UrbanLogiq’s New Crash Analysis Use Case Is Here
Public officials have a particularly complex job when it comes to crash analysis. Crash data, or the information derived from the police reports following a car crash, is challenging to analyze in large volumes for a number of reasons. For starters, nomenclature and formatting vary greatly between jurisdictions, and the data is stored in file formats that don’t lend themselves to easy analysis. As a result, deriving actionable insights and reporting effectively on road safety initiatives can require a great deal of data wrangling, normalization, and analytical modelling. This ultimately hinders and slows down efforts along the road to Vision Zero.
Putting data in context
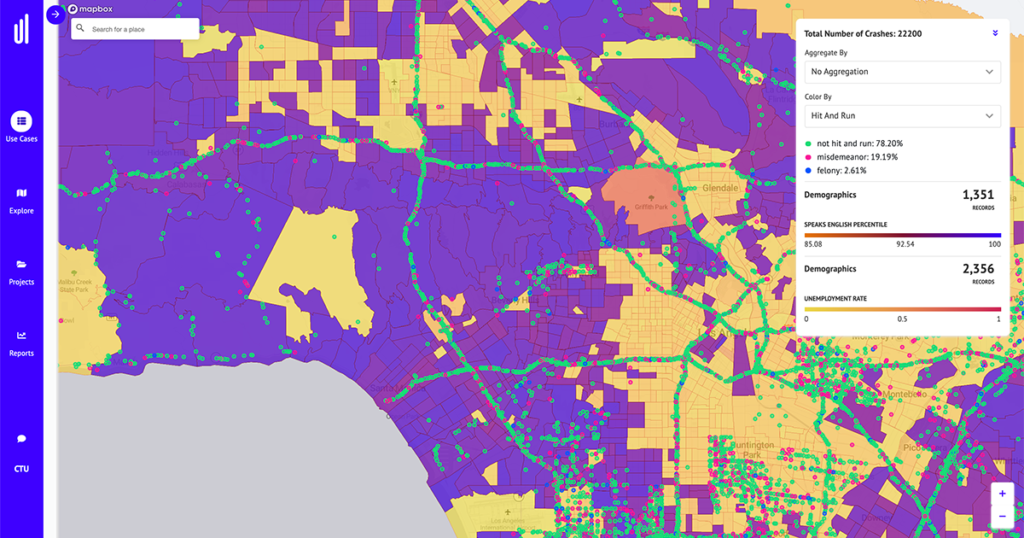
UrbanLogiq geocodes crash data from any source or format so it can be viewed on a digital map. Our new Crash Analysis use case visualizes crash data alongside relevant contextual information and user-friendly analytics, helping public officials more easily recognize and report on patterns and trends in the data. This enables city leaders to target and measure road safety initiatives more effectively, at a lower cost than traditional methods.
Below, we explore what this looks like in action.
Analyze all of your crash data in one unified platform. Quickly aggregate data by spatial layers such as intersections, road segments, corridors and council districts.
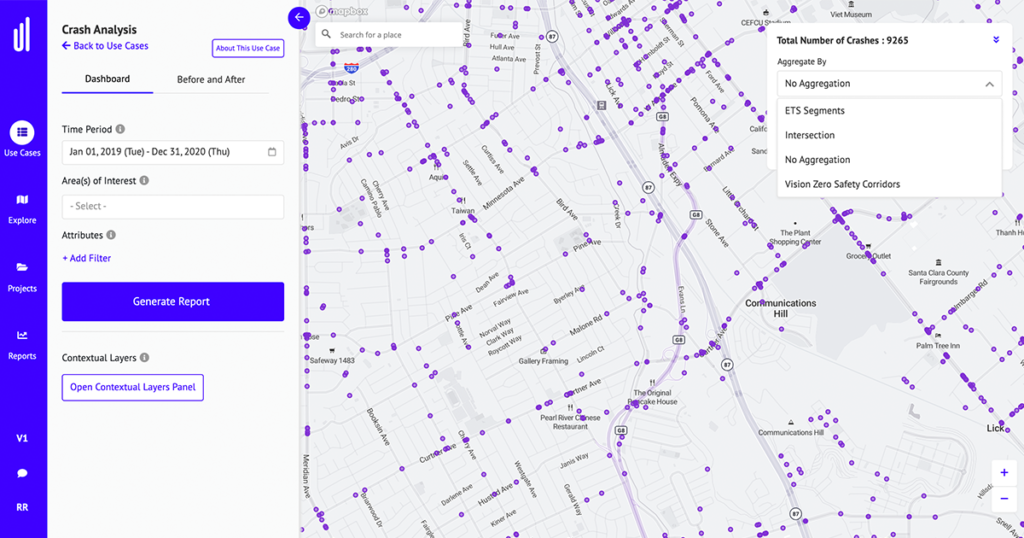
Crash data geocoded and visualized in the UrbanLogiq platform, filtered by time period selection
Use filters and spatial selection tools to analyze geographies of interest by the attributes that matter to you.
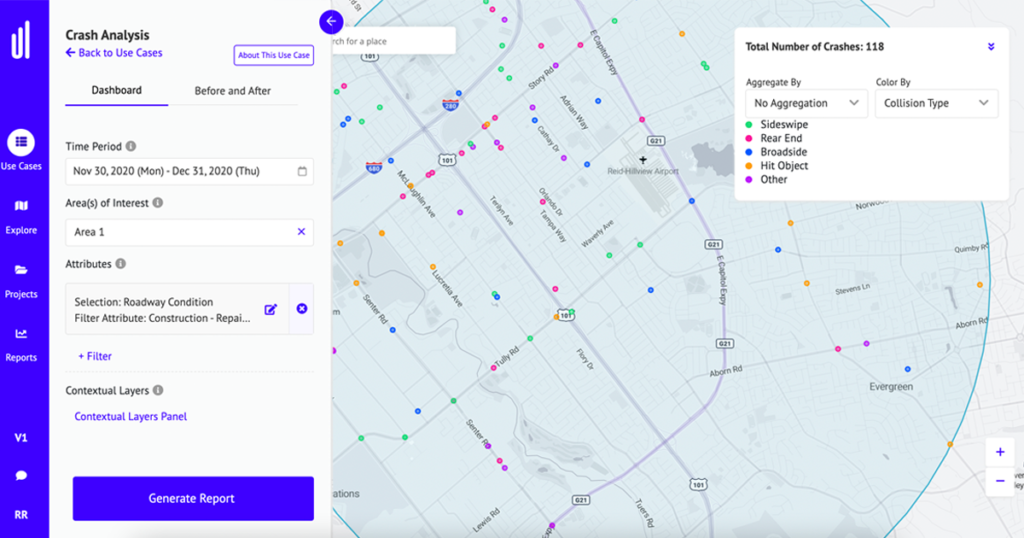
Crash data visualized in the UrbanLogiq platform, filtered by roadway condition and colored by collision type
Layer contextual data layers such as infrastructure, land use, demographics, and more alongside crash data to gain deeper insights.
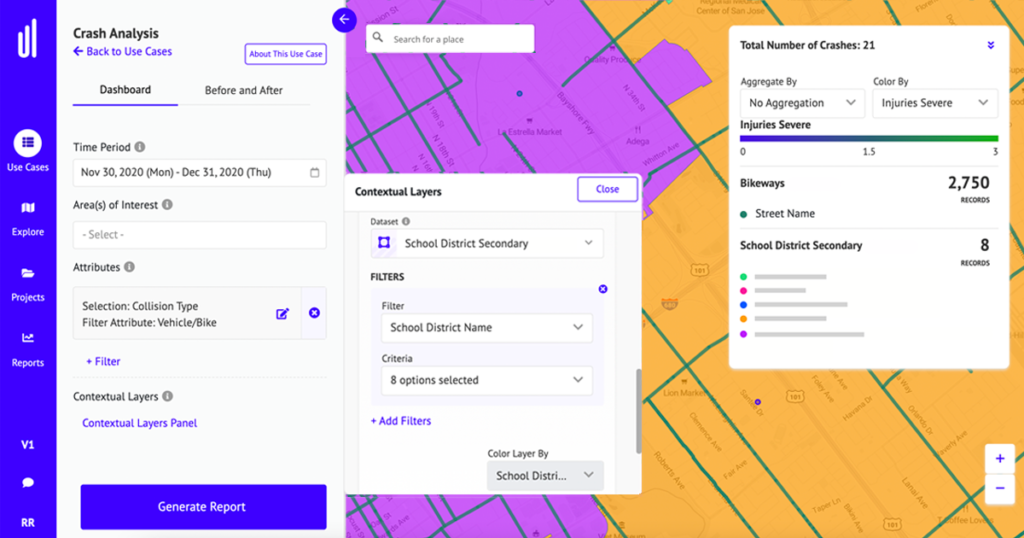
Vehicle/bicycle collisions visualized in the UrbanLogiq platform alongside secondary school districts and bikeways
Generate dynamic reports that provide useful analytics related to the selected data, for example, crash count by collision type
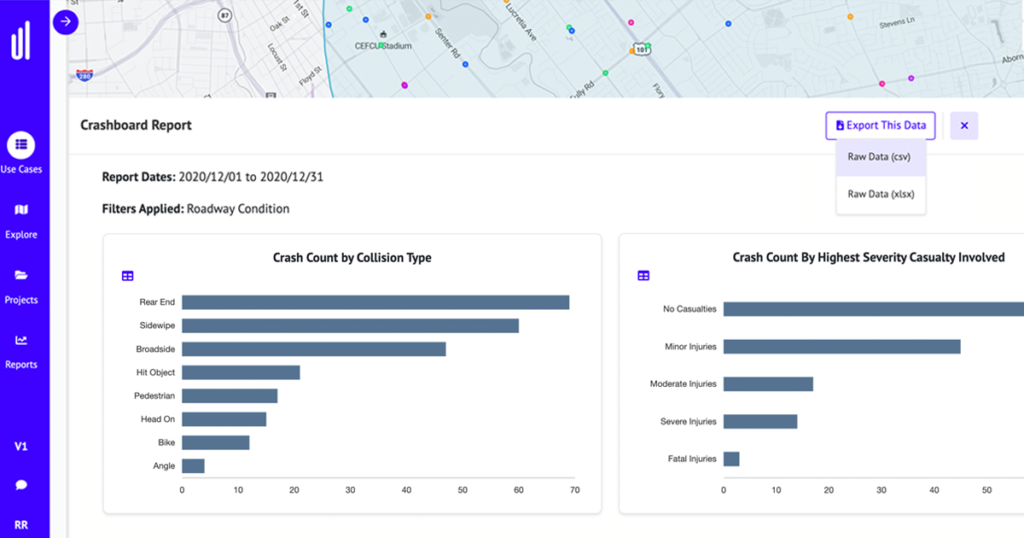
Crash report with summary analytics about the selected geography in the UrbanLogiq platform
Perform Before and After analysis to measure the effectiveness of safety initiatives or countermeasures
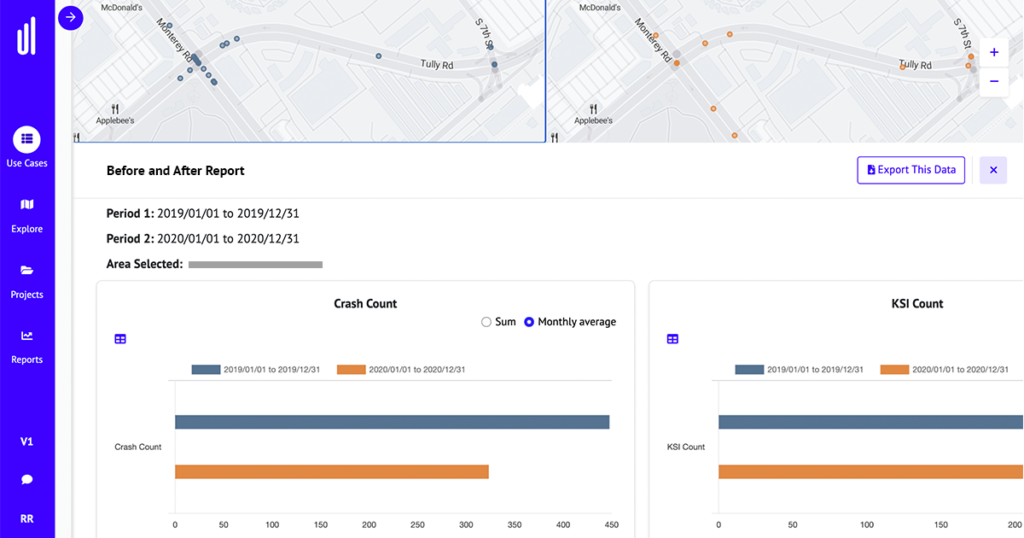
Before and After report displaying analytics related to the comparison of two date ranges in the UrbanLogiq platform
Car crashes cost lives and damage communities. UrbanLogiq’s new Crash Analysis use case assists government agencies with or without a Vision Zero program to achieve a contextualized and data-driven understanding of how to make transportation safer for all road users in their community.
Want to learn more?
Get fast, timely insights from your data. UrbanLogiq helps agencies move away from labor-intensive manual processes, centralize critical workflows, and get to insights faster. Contact us today to book a 30-minute demo.
