Integrated analysis
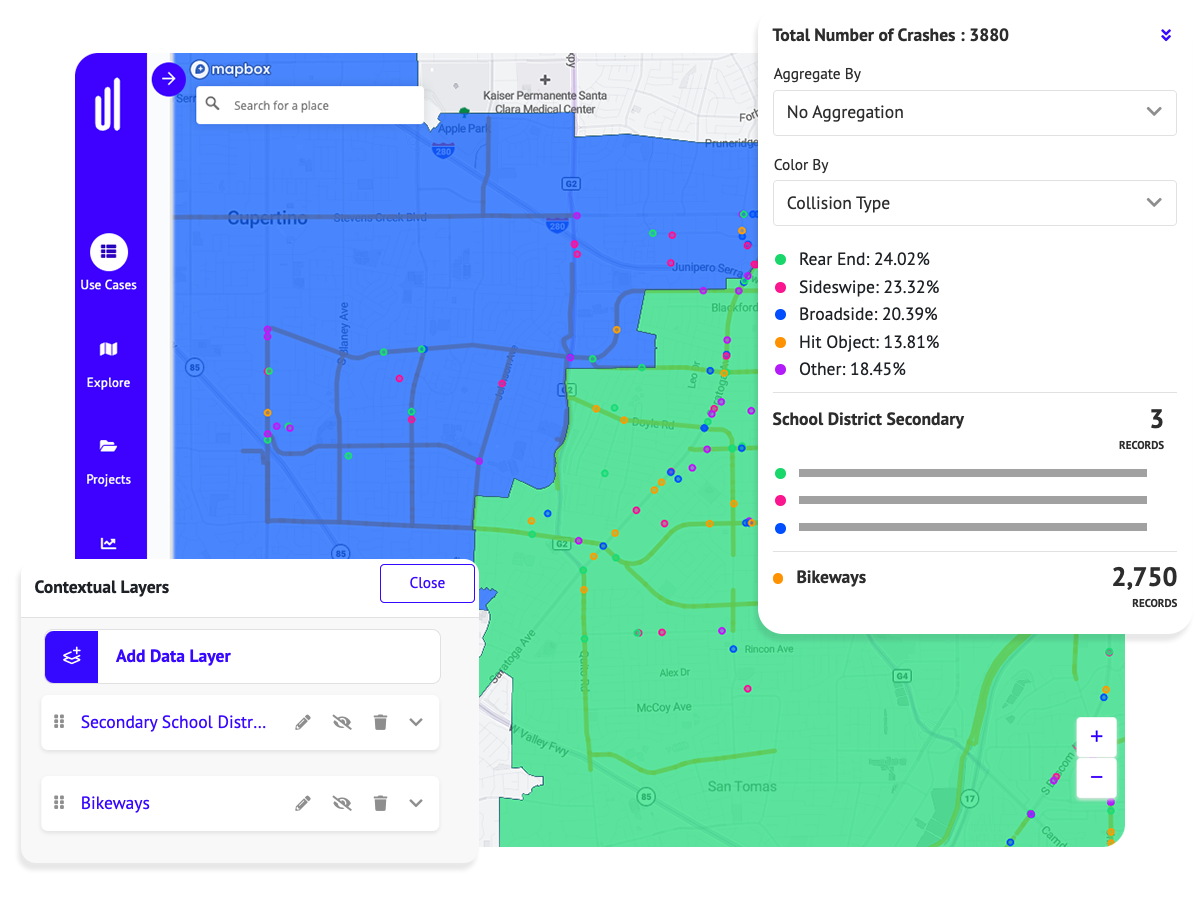
Analyze your crash data geospatially alongside contextual data from dozens of sources to gain fast insights and detect patterns at a glance.
Dynamic reporting
Generate dynamic reports of crash trends and attributes according to critical areas of interest or conduct a streamlined Before and After analysis.
Automated metrics
Get valuable safety metrics in a few quick clicks including “Top 10” dangerous rankings, KSI counts, heatmaps, and more for any geography of interest.
Detect trends and anomalies without time-consuming manual calculations, mapping, or data cleaning
- Get the information you need quickly with spatial selection, data joins, and filters to analyze key corridors and intersections.
- Map network-wide trends using visualization tools such as geospatial aggregations, heatmaps, and color-coding by crash attributes.
- View crash data in context alongside data layers such as traffic volumes, infrastructure, land use, demographics, and more.
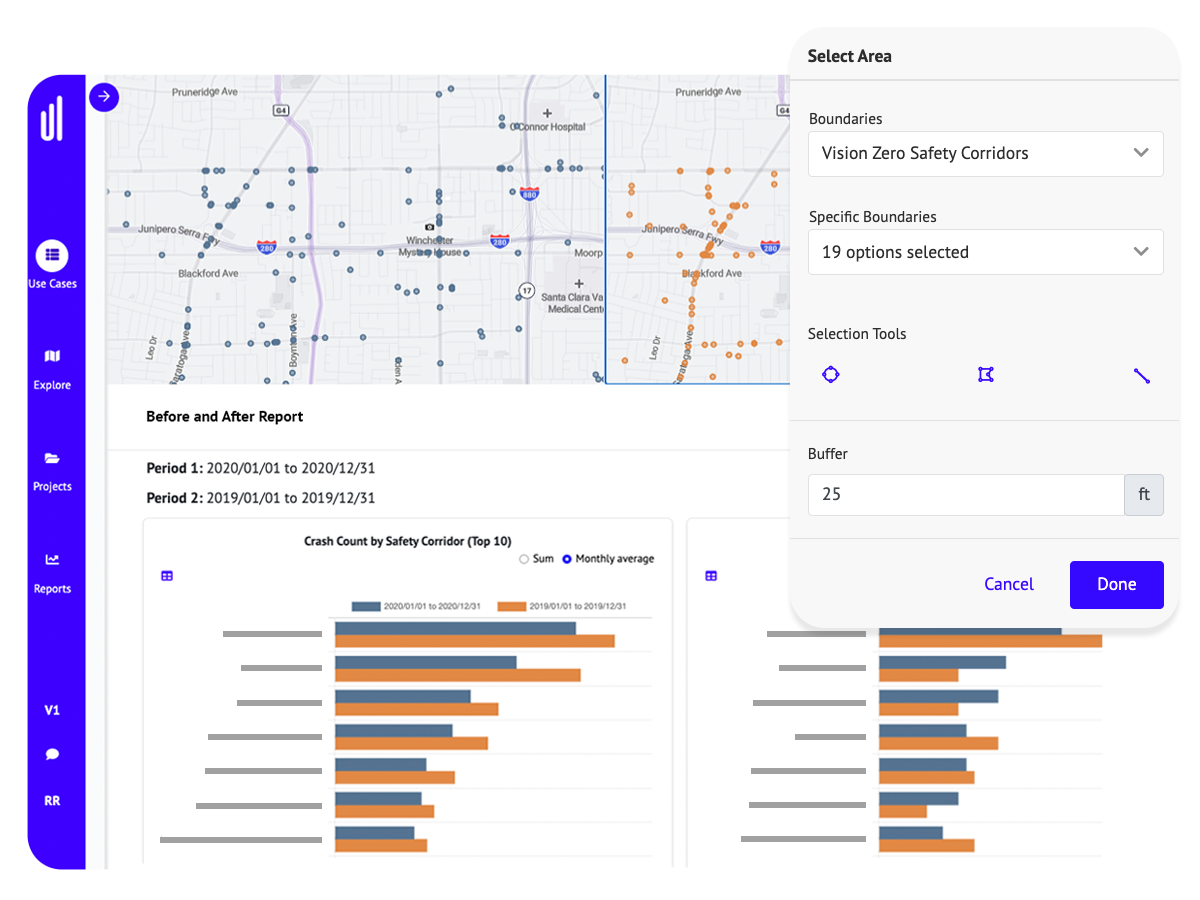
Measure the efficacy of safety countermeasures and Vision Zero policies over time
- Access automated safety metrics, such as KSI, based on a time range or geography of interest.
- Easily benchmark and compare the performance of safety initiatives and countermeasures over time with Before and After analysis.
- Streamline reporting for strategic planning, grant applications, or reports to council.
Road Safety Professional Services
UrbanLogiq provides professional services powered by the best in data engineering and data science to take your road safety initiatives to the next level.
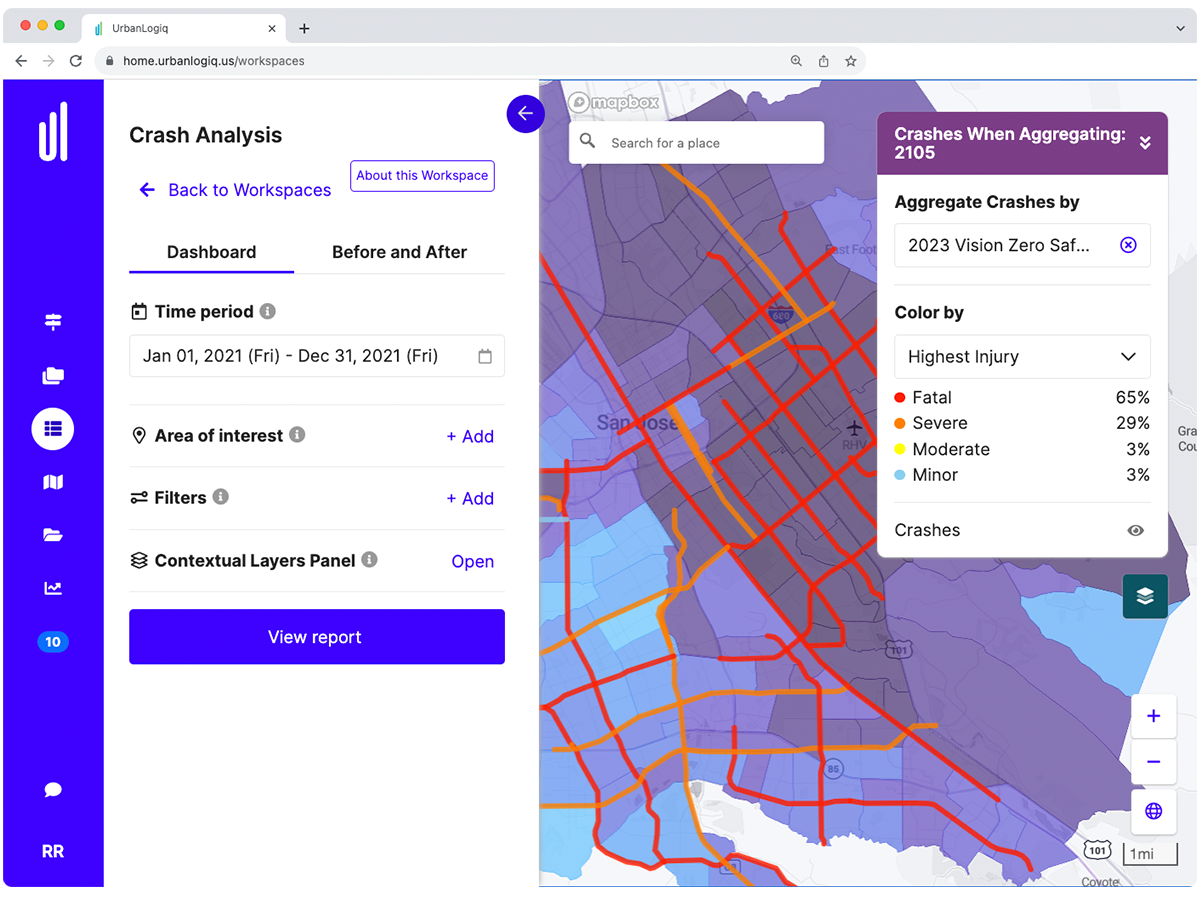
High Injury Network Development
High Injury Networks (HIN) are essential for public agencies to pinpoint where investments can most effectively reduce fatal and severe crashes. At UrbanLogiq, we craft bespoke High Injury Network models for cities, utilizing a richer data set than typical models offer. These HINs can be offered directly through our dynamic platform or as a standalone report.
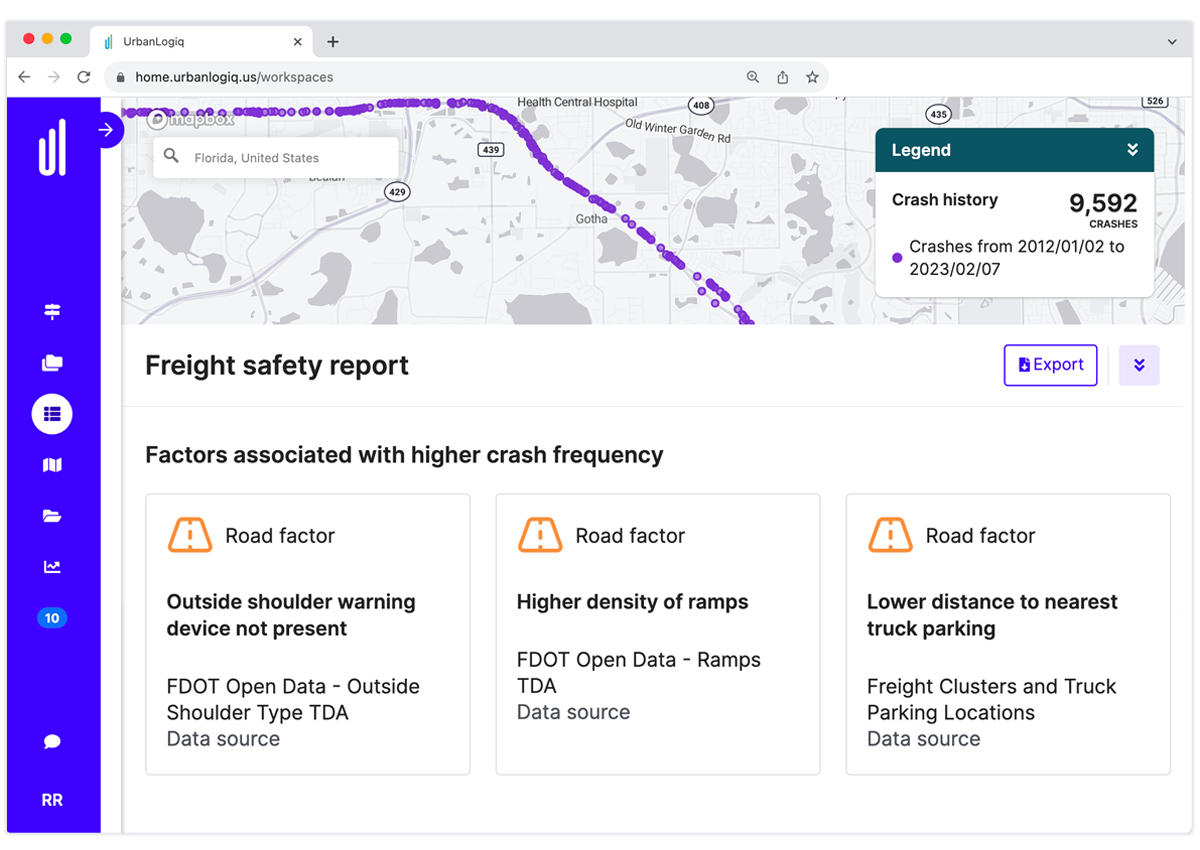
Contributing Factors Analysis
UrbanLogiq's Contributing Factors methodology helps cities understand the root causes of severe crashes. By examining the context of each crash, and then leveraging data science analysis techniques, we can uncover hidden factors, guiding agencies towards smarter, targeted investments.
Equitable Road Safety Analysis
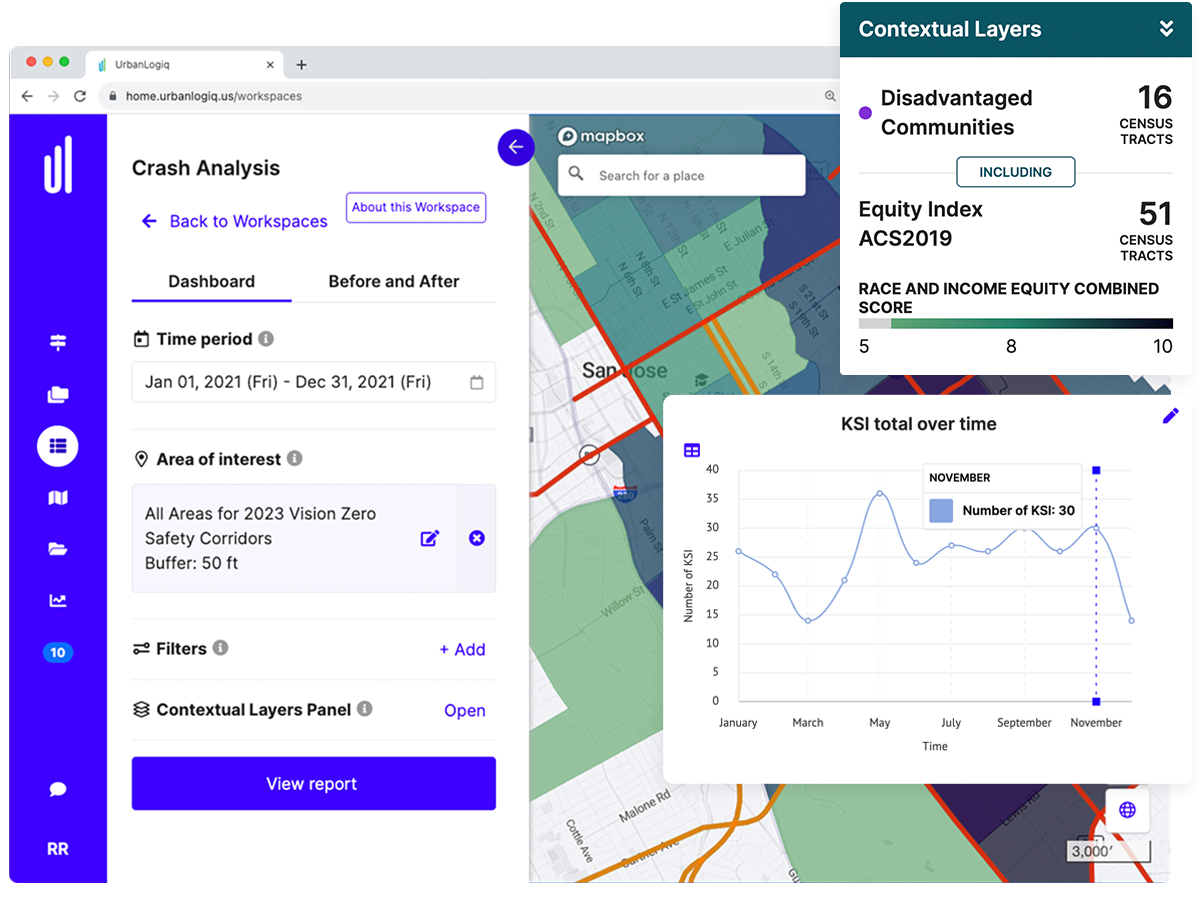
UrbanLogiq integrates your crash data with equity-focused data layers and contextualizes it through visualization within our geospatial platform. This intuitive exploration reveals disparities in road safety, providing you with valuable insights to strategically prioritize countermeasures, target resources, and tell a story with data.
Before and After Analysis
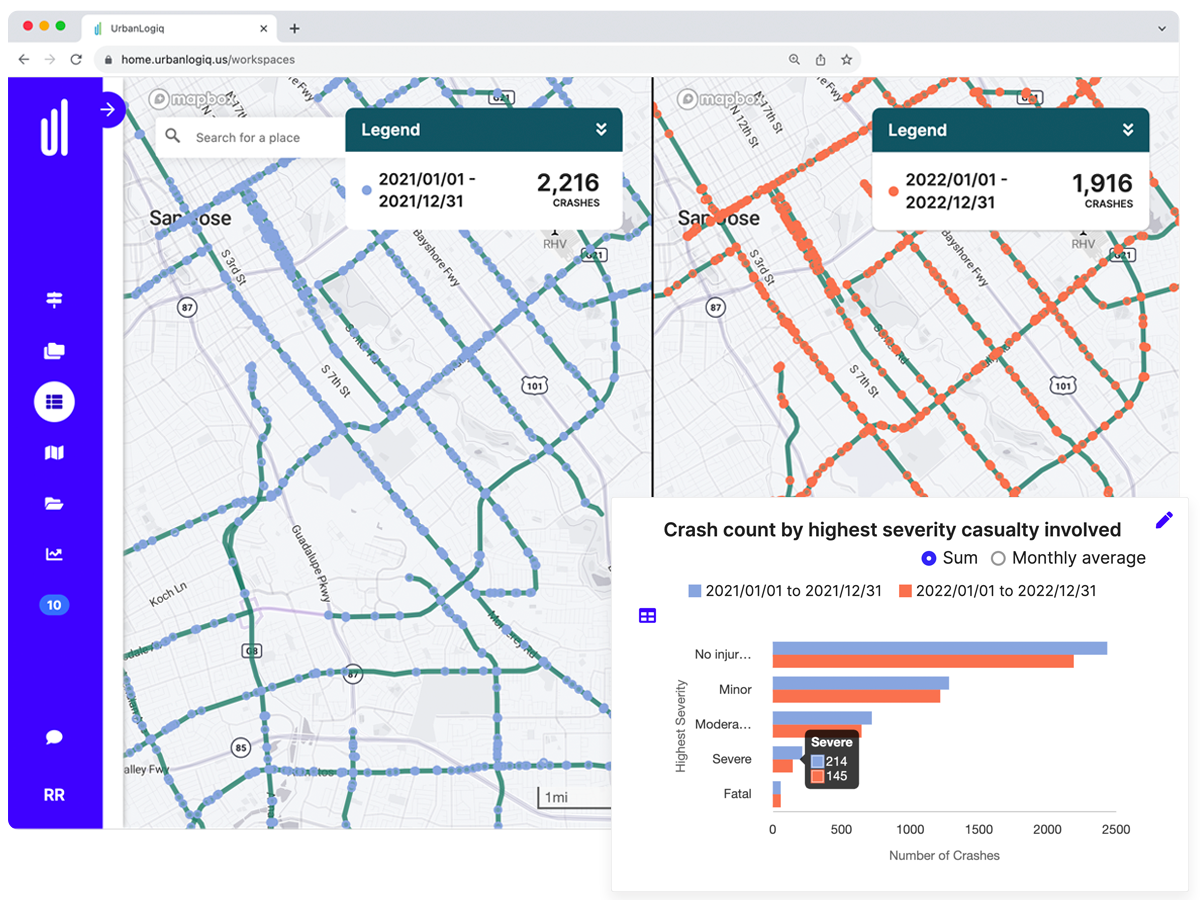
Evaluating the success of countermeasures is crucial, yet often made challenging by the inaccessibility of crash records. UrbanLogiq makes it easier to tap into historical crash records by automating data cleaning, geolocation, and visualization. Then, we provide public agencies with deep analysis of the impact and returns on past infrastructure investments.
Request a Demo of Crash Analysis


Trusted by governments across North America

