What Is Peak Hour Factor (PHF)?
If you drive, Peak Hour Factor (PHF) plays a role in your life on the road. You have likely heard the terms “Peak hour” or “rush hour” before, or even used them to refer to the time when traffic is the heaviest. I bet there has also been a time when you sat in your car at a traffic light wondering why it’s taking so long to turn green. In this blog, you’ll learn about PHF and how these two things are connected, so read on!
What is Peak Hour Factor?
Simply put, PHF is a means to measure the variation in traffic demand. To understand PHF it’s important to note that the peak hour splits into four fifteen-minute intervals. PHF compares the busiest fifteen minutes of the peak hour with the total volume of vehicles that pass through a specific area during the peak hour period to indicate how steady traffic is.
What is Peak Hour Factor used for?
PHF illustrates what the traffic flow looks like in an area. Traffic engineers use PHF as an input in a slew of traffic-related calculations such as Level of Service (LOS), determining the number of lanes needed for a highway or road based on traffic flow, or signal timing, just to name a few. To program traffic lights and signals effectively, you need to know which direction has the most amount of cars at what time of the day.
Picture this: it’s rush hour and there is a steady stream of vehicles going northbound at an intersection. Barely any cars are traveling eastbound or westbound, but the traffic lights are timed to give each direction the same amount of green time. The constant stop and go would end up causing a lot of congestion! In that scenario, traffic engineers would use the PHF to determine that the northbound traffic requires a longer green light to alleviate congestion during that time period. As such, if you are traveling in the direction of less traffic, you may sit at a light a little bit longer before you get through.
Calculating PHF
Calculating the PHF requires the total traffic volume for each fifteen-minute interval within the peak hour. You then take that total and divide it by four times the volume of the busiest fifteen minutes within the hour. The closer the PHF is to 1, the more consistent the traffic flow.
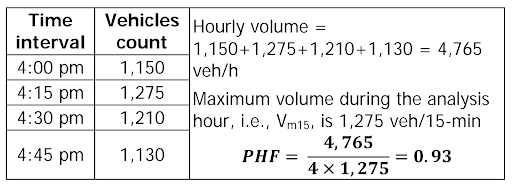
Check out the example and formula laid out in the graphic below.

Example peak hour factor calculation from the FHWA Traffic Data Pocket Guide
Peak Hour Factor vs Peak Hour Volume (PHV)
Traffic engineers try to design highways and roads to sufficiently serve traffic volumes during the peak hour in the peak flow direction. To do that, they must know the maximum number of vehicles that travel through a certain point along a highway or road during the peak hour; that is PHV. The difference between the two is that one is a factor of the other. In order to figure out PHF you will first need to determine the PHV. The example pictured above indicates it clearly. PHV is the total sum of the vehicle count for each fifteen-minute interval (4,765).
Automating critical traffic metrics
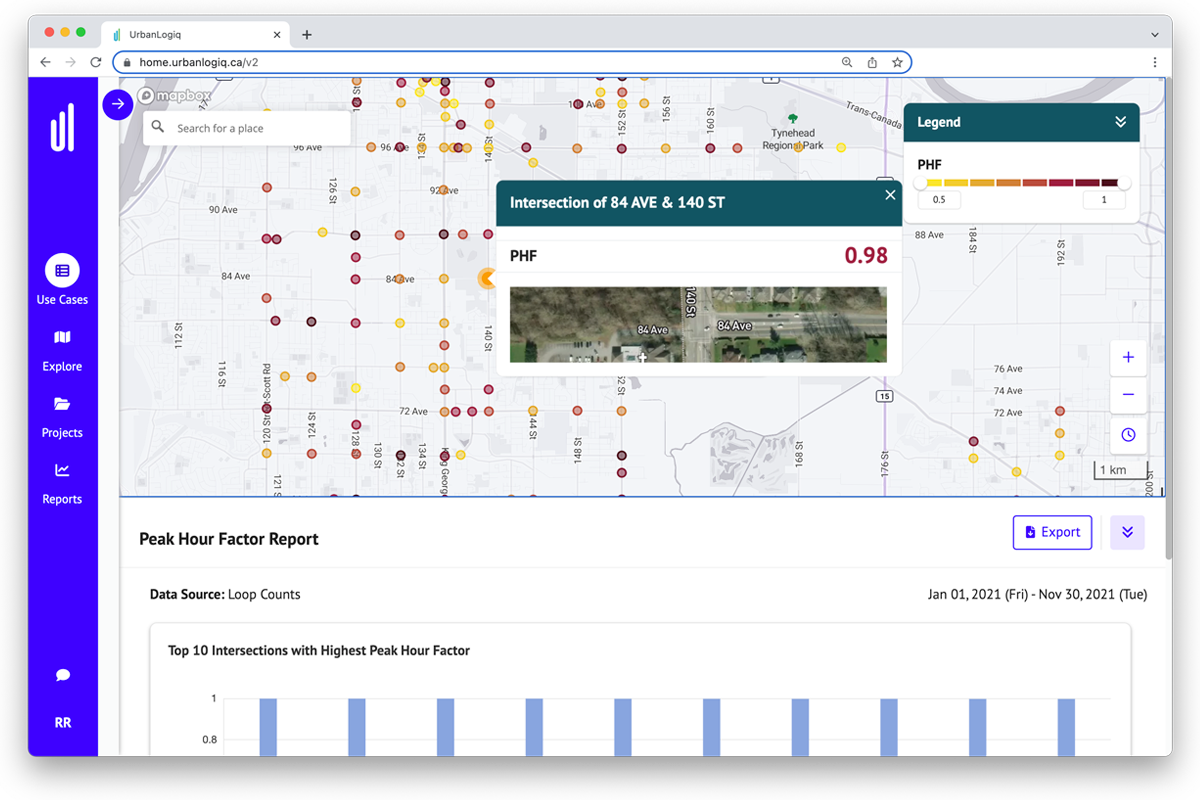
Cities spend a significant amount of time and money to calculate PHF. This is due to the amount of data collection, centralization, normalization, and manual calculation required. UrbanLogiq is an example of a tool that automates the calculation of important traffic and transportation metrics. Using the UrbanLogiq platform, public officials can automate metrics like Peak Hour Factor, Peak Hour Volume, Annual Average Daily Traffic (AADT) and more in just a few clicks.

Example of PHF automatically calculated in the UrbanLogiq platform
How UrbanLogiq helps
Get fast, timely insights from your data to better understand mobility in your community. UrbanLogiq helps agencies move away from labor-intensive manual processes, centralize critical workflows, and get to insights faster. Contact us today to book a 30-minute demo at Urbanlogiq.com


