Peak Hour Measurements: How accurate do data sources need to be?
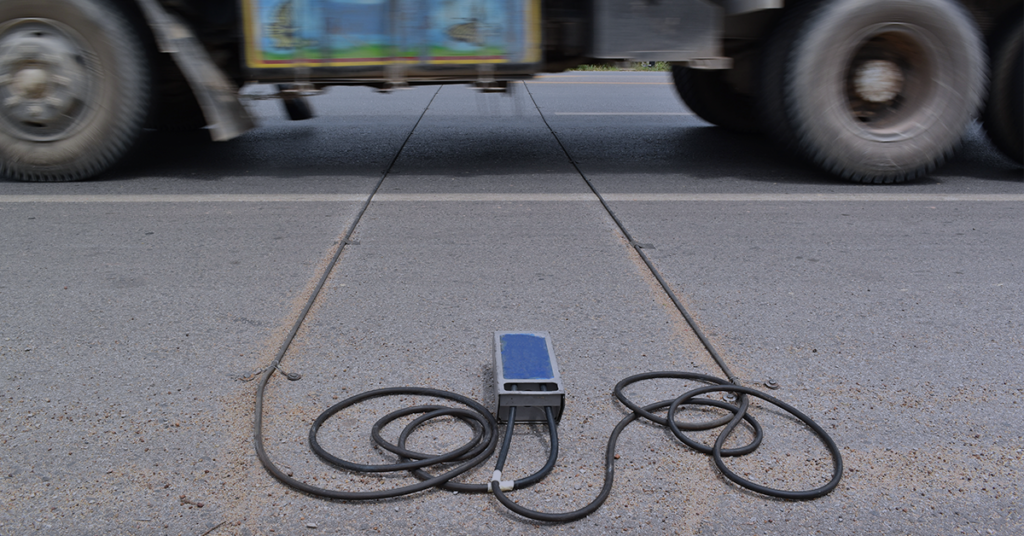
The last few years have seen an explosion of new datasets to measure traffic patterns. Internet of Things (IoT) sensory technology, connected vehicles, location-based data, telecommunications data, computer vision… the list goes on. Emerging and traditional datasets, such as manual counts and data from traffic sensors are increasingly used together in transportation engineering, operations, and planning workflows. Accordingly, questions often arise about the accuracy of different data sources.
To better understand the effects of inaccurate data, UrbanLogiq applied a statistical simulation to analyze the different levels of accuracy of collected traffic volume data and its effects. To start, we focused specifically on the calculation of peak hour, seeking to answer the formalized question:
What is the probability of a peak hour measurement being correct given that the data used to compute it is only accurate to a certain level? In addition, does this probability depend on the type of road (total volume, original Peak Hour Factor [PHF]) that is being measured?
Why are peak hour measurements important?
The peak hour (and by extension, the PHF) is used as an input in many traffic related calculations and workflows. The Highway Capacity Manual makes use of PHF in roughly 100 cases, including Levels of Service (LOS) and signal timing calculations. Accurate knowledge (or inaccurate knowledge) of the peak hour can have far reaching implications when it comes to traffic management. This means that as we explore the potential of new, emerging datasets as viable alternatives, the peak hours calculated using them need to be reliable.
The goal of this work is to provide transportation professionals with an understanding of the implications of data inaccuracy levels when evaluating different datasets and applying them to solve use cases including peak hour calculation and others.
You can download the full white paper to read the entire study, but for those just interested in the results, we provided the resulting lookup tables below for quick reference.
>> Download the full white paper here <<
Your quick reference guide
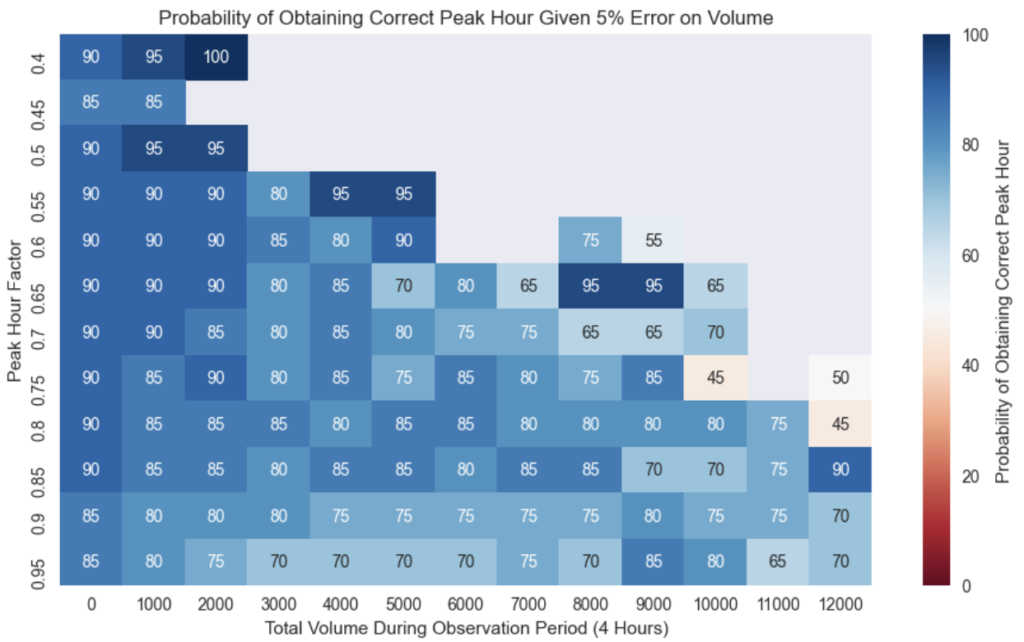
The reference tables below are intended to provide a quick and easy way to determine if peak hour measurements being calculated using any traffic data source with known accuracy are likely to be correct.
Click on any volume data error rate below to jump to that section of the article and determine the projected accuracy of your peak hour calculations.
My volume data has a 5% error rate.
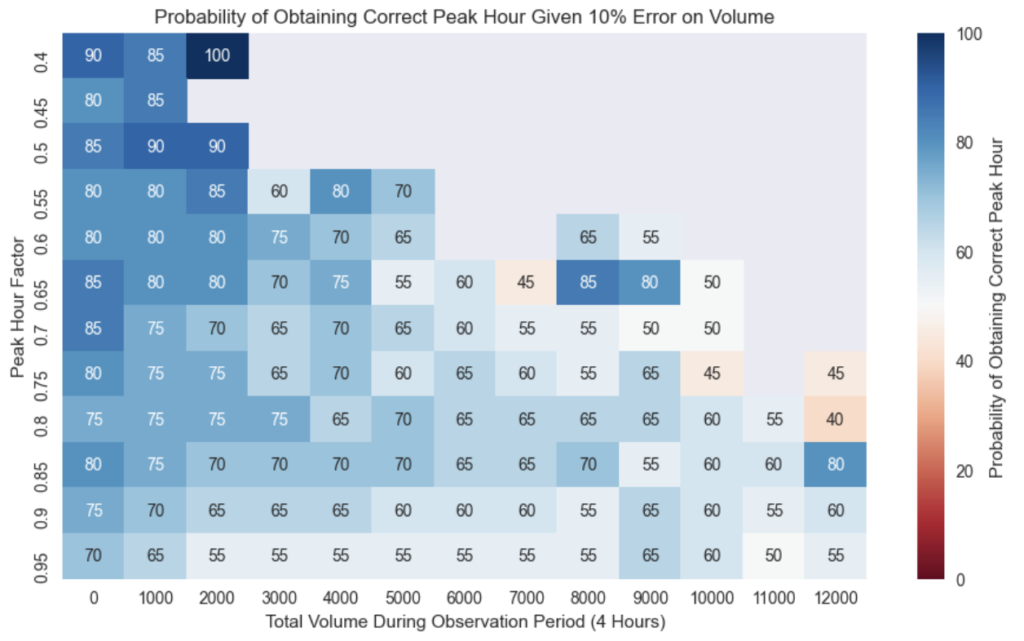
My volume data has a 10% error rate.
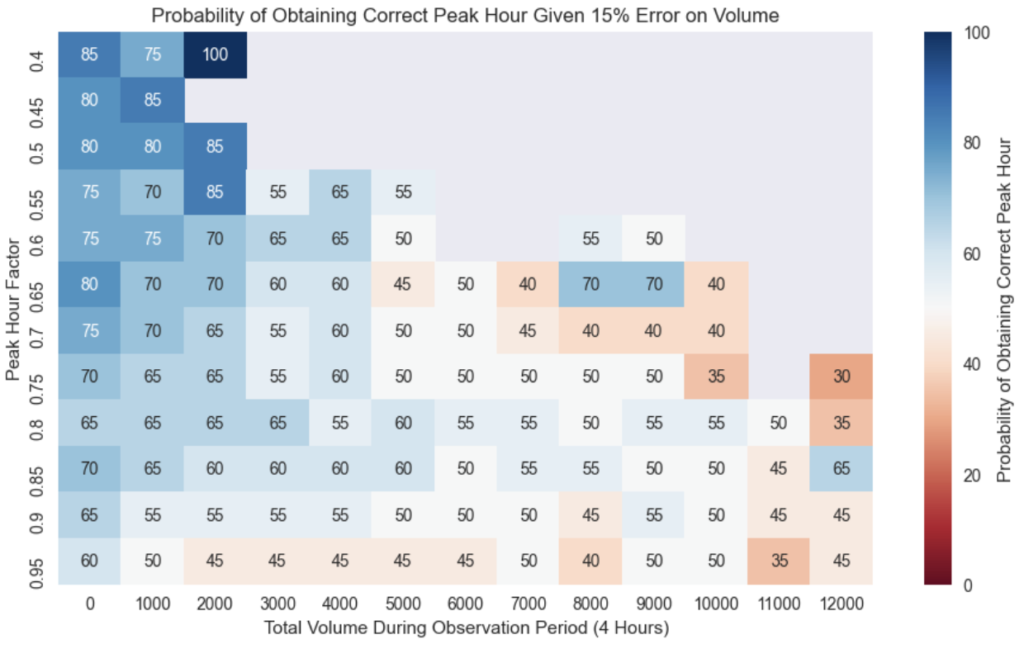
My volume data has a 15% error rate.
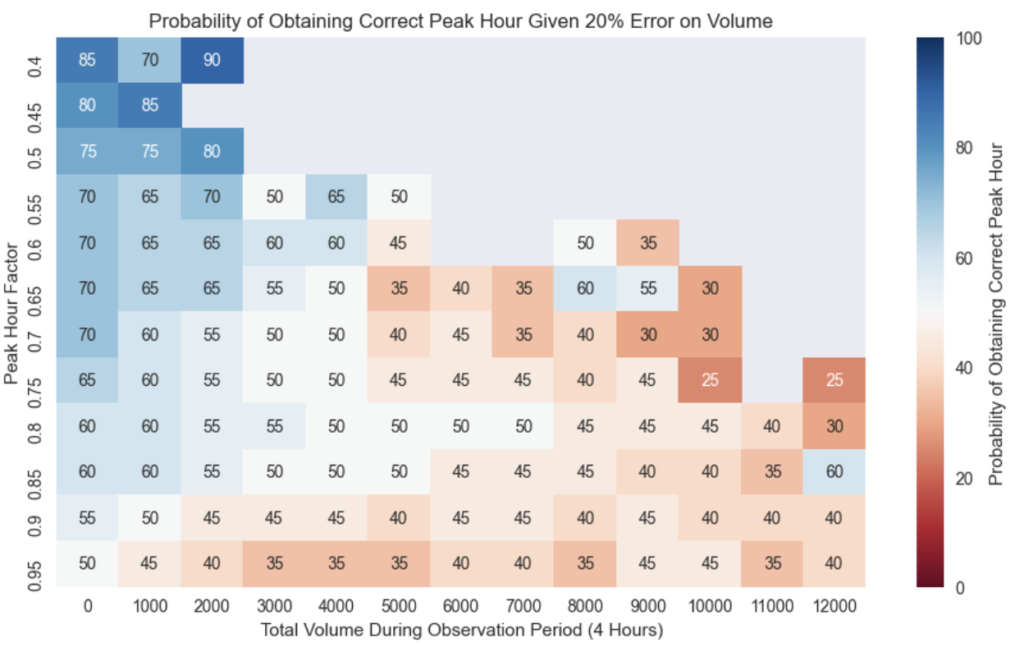
My volume data has a 20% error rate.
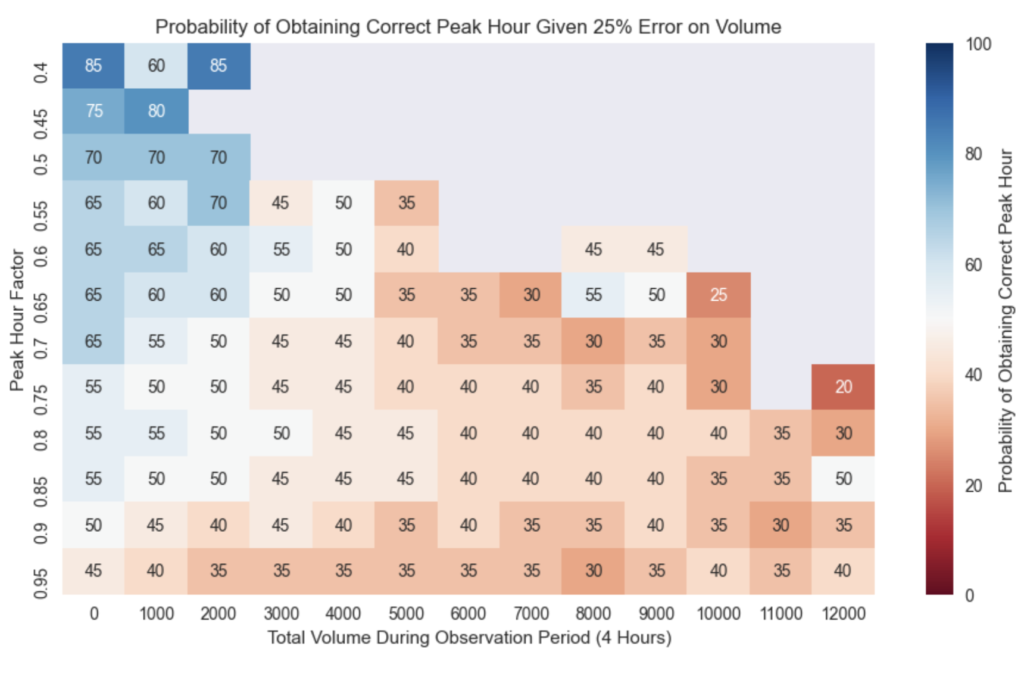
My volume data has a 25% error rate.
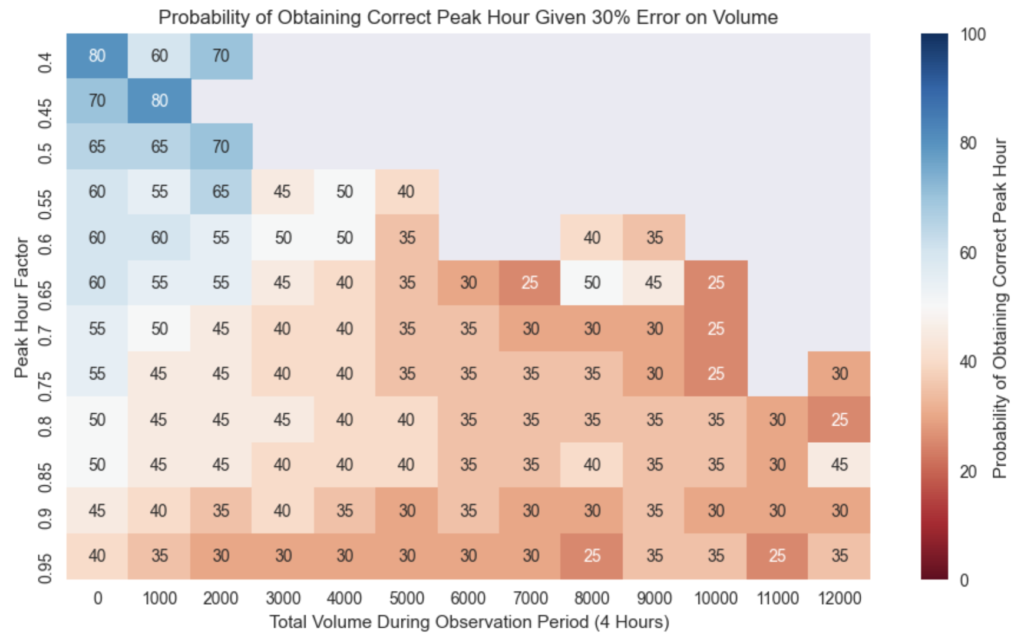
My volume data has a 30% error rate.
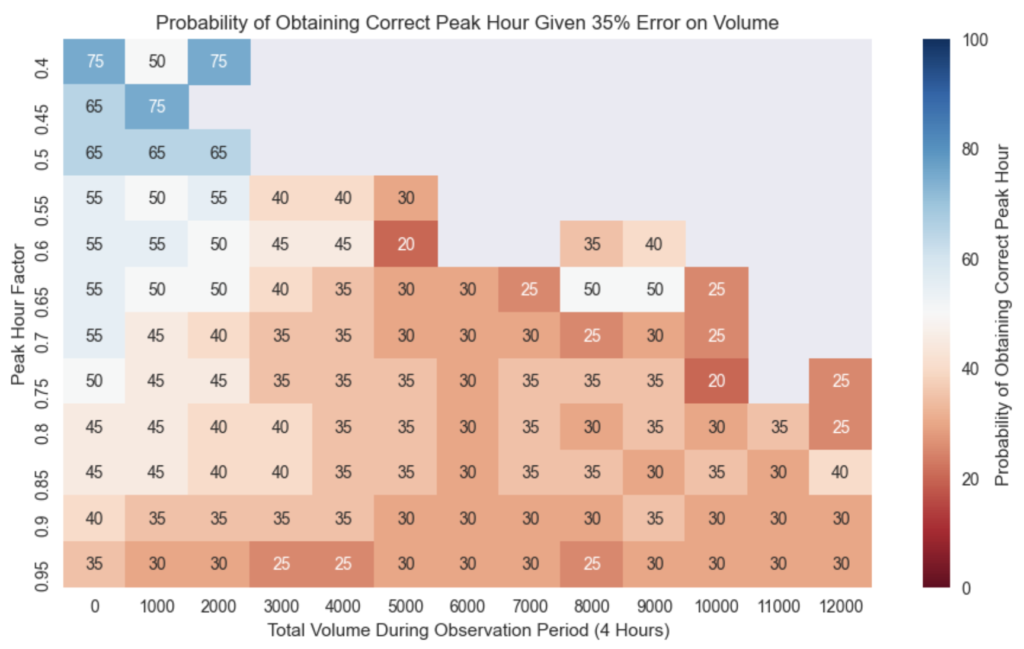
My volume data has a 35% error rate.
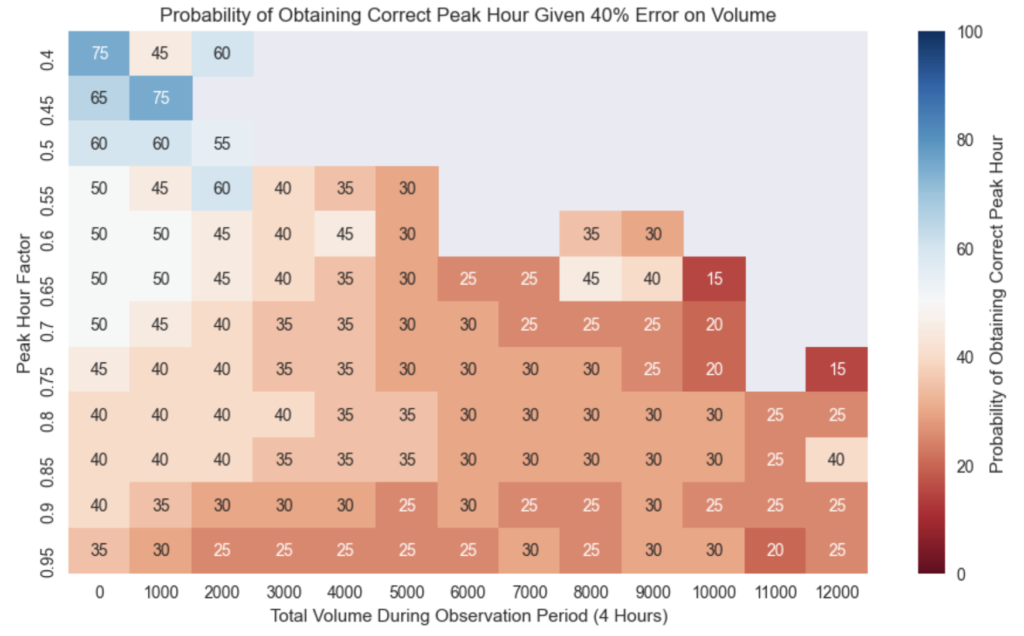
My volume data has a 40% error rate.
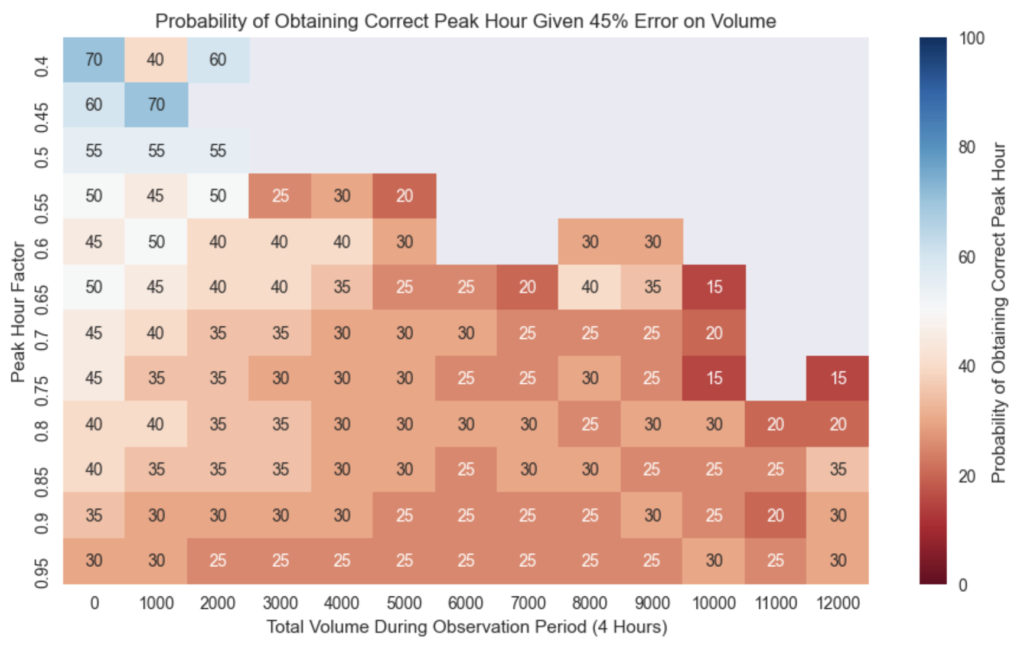
My volume data has a 45% error rate.
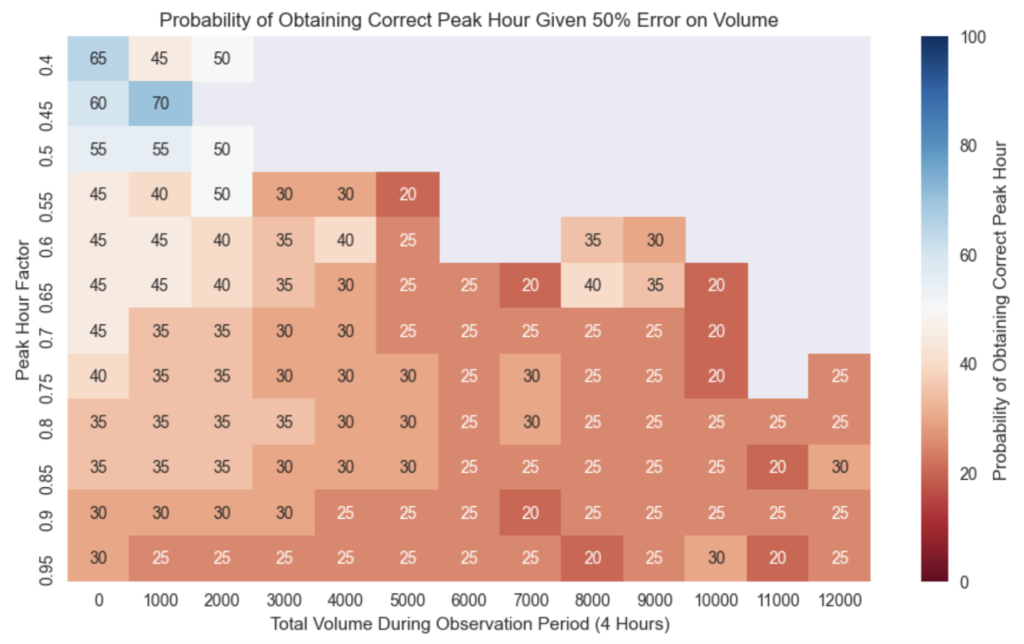
My volume data has a 50% error rate.
My volume data has a 55% error rate.
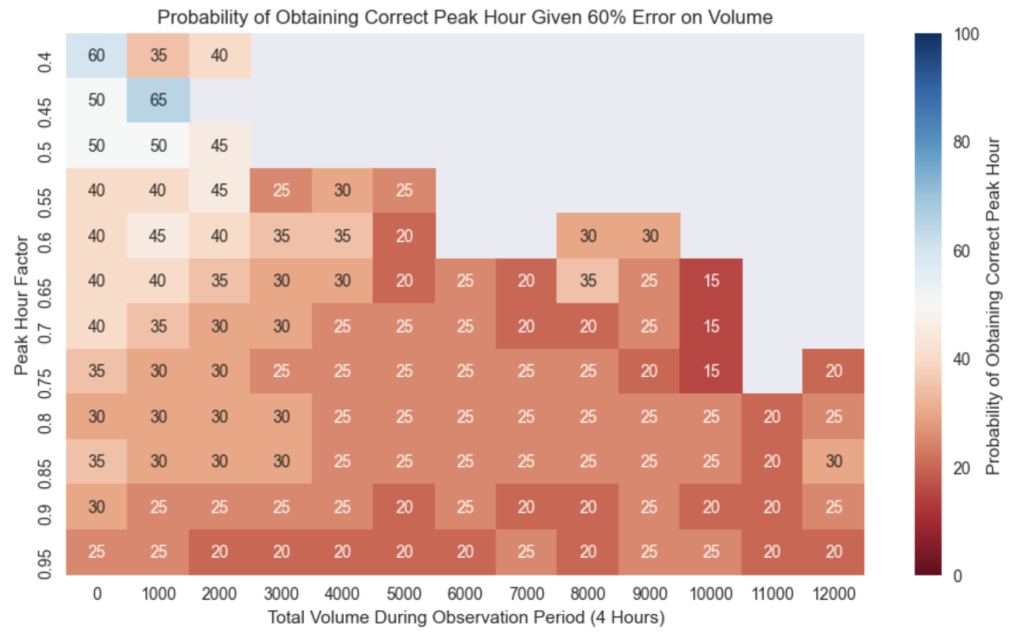
My volume data has a 60% error rate.
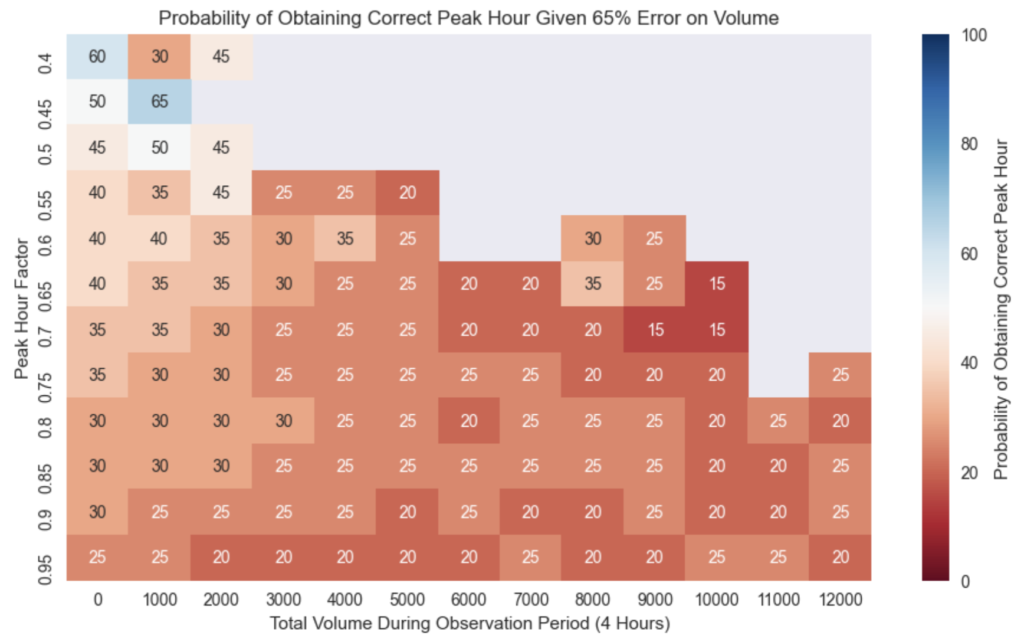
My volume data has a 65% error rate.
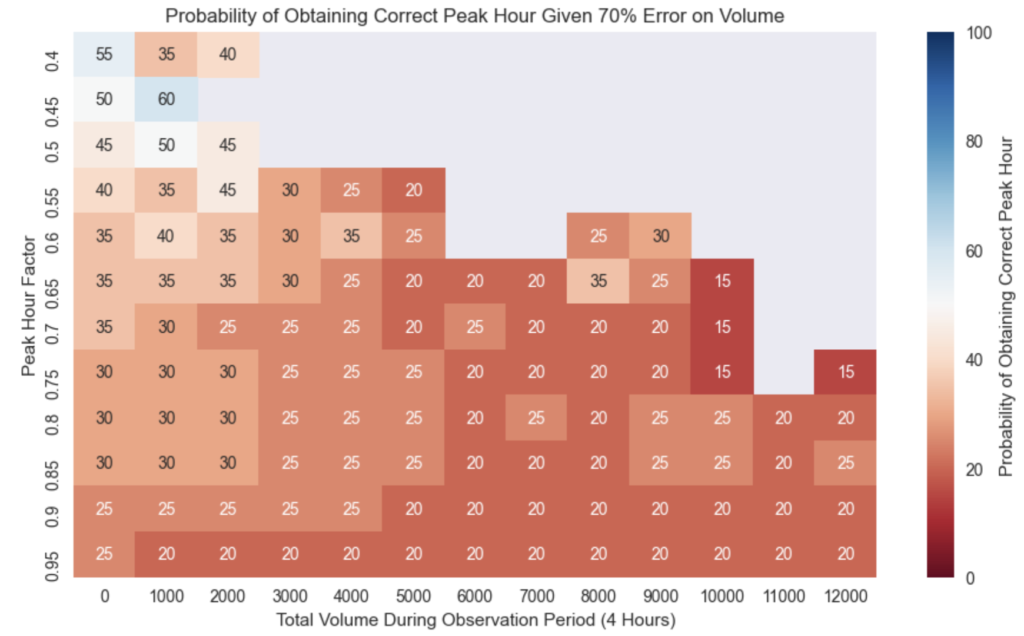
My volume data has a 70% error rate.
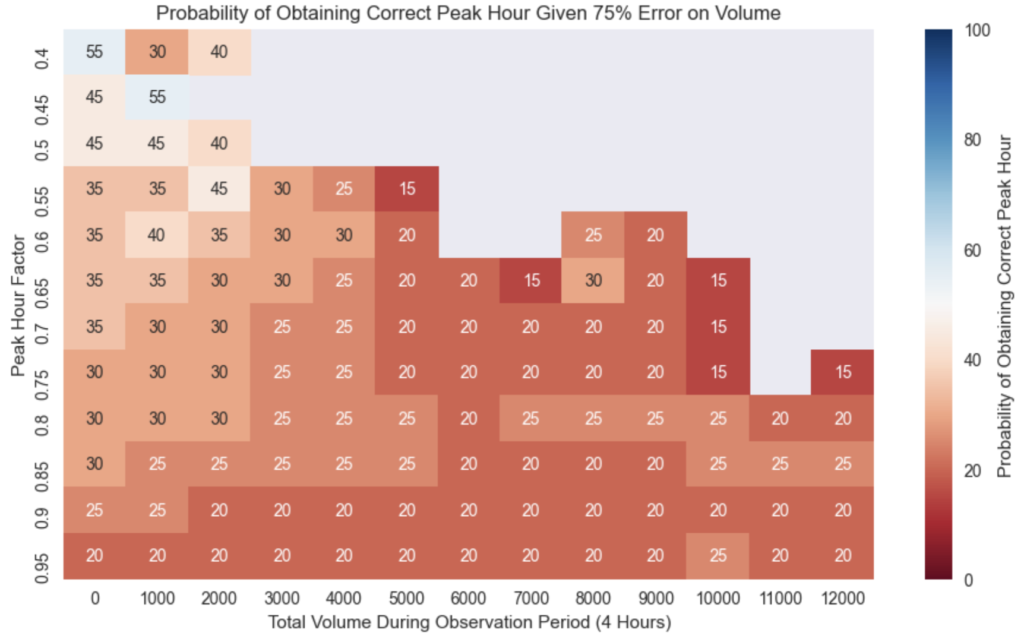
My volume data has a 75% error rate.
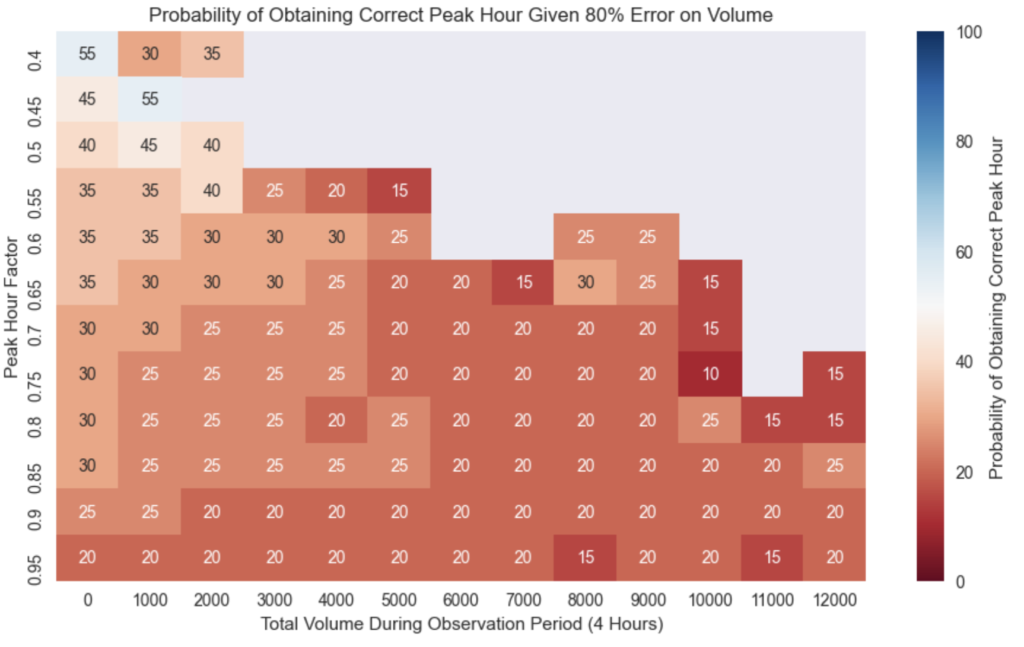
My volume data has a 80% error rate.
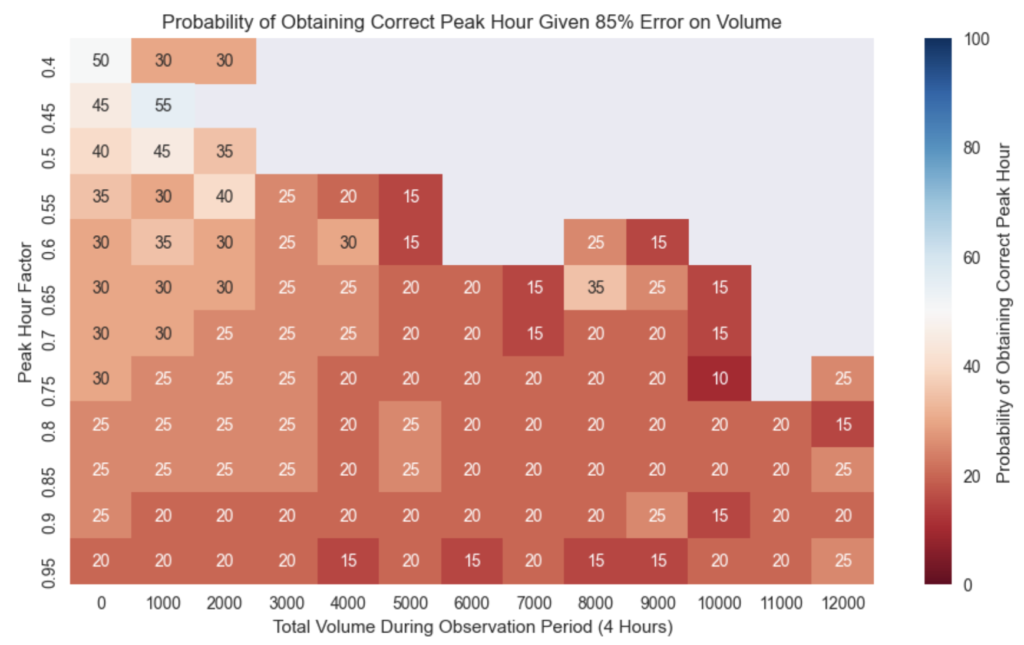
My volume data has a 85% error rate.
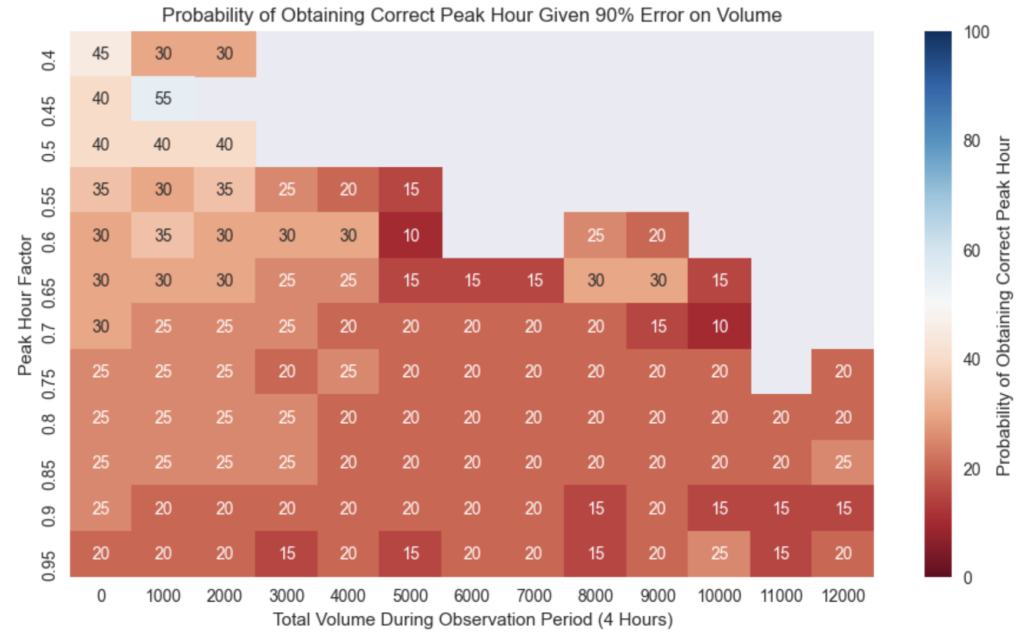
My volume data has a 90% error rate.
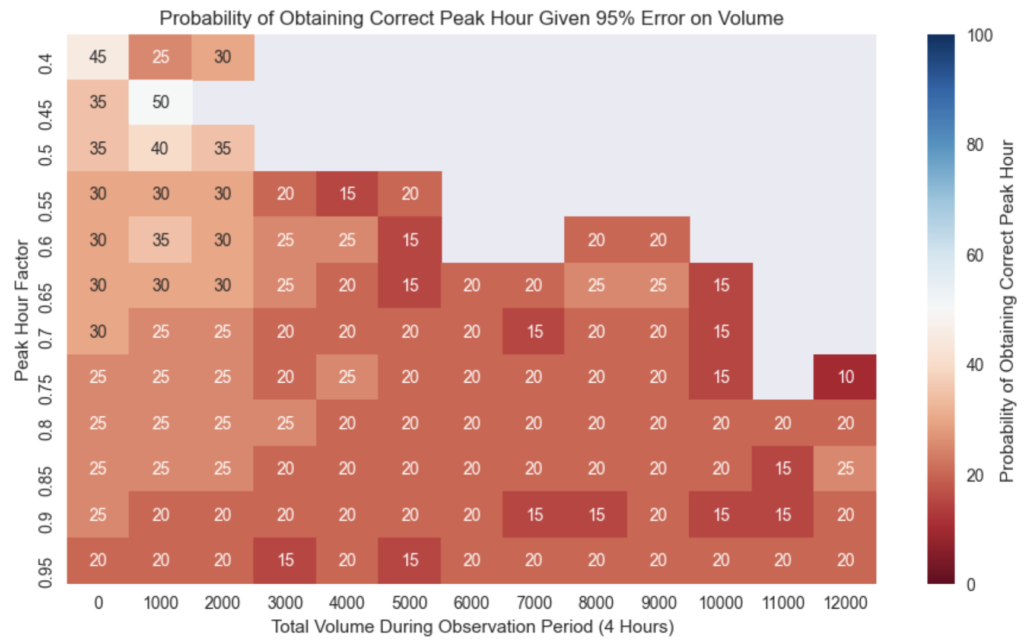
My volume data has a 95% error rate.
My volume data has a 100% error rate.


About UrbanLogiq
UrbanLogiq is a cloud-based software solution that empowers government users to access more actionable and accurate insights from data. Contact us today to schedule a personalized demonstration of the UrbanLogiq platform.