Measure and Manage Active Transportation Data With UrbanLogiq
Today, many governments are investing in initiatives designed to encourage and measure the use of active transportation, including protected bike lanes, widened sidewalks, e-bike and scooter programs, sensor technology purchases, and more. These efforts are part of comprehensive transportation plans that seek to improve safety for all road users, reduce greenhouse gas emissions from vehicles, and make cities more livable overall.
To effectively track and report on the progress of these initiatives and active transportation trips overall, implementing efficient systems for data collection and analysis is essential.
How UrbanLogiq helps
UrbanLogiq’s Active Transportation use case helps transportation professionals centralize, integrate and visualize their active transportation data originating from different sources and formats, alongside other relevant or contextual datasets such as vehicle traffic counts, crash data, or the built environment.
Our secure geospatial platform provides users with summary reports and helpful insights to more efficiently understand and inform their community’s mobility roadmap: from pedestrian flows, to pathway network gaps, to safety infrastructure and complete streets.
Let’s take a closer look at what this looks like in action.
Access and visualize active transportation data without any manual processes or data cleaning
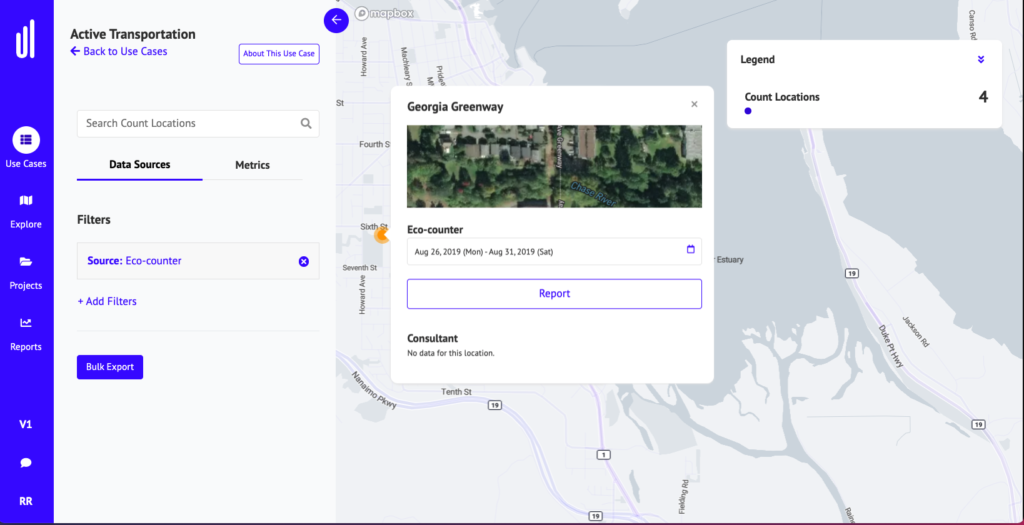
The UrbanLogiq platform visualizes data from Eco-Counter devices, Strava, big data providers, manual count reports, crosswalk studies and more inside a centralized platform. We process, transform, geocode and perform quality assurance on the data so that users can easily see what data they have at a glance, and spend more time on high-value tasks.

Active transportation counts from Eco-Counter devices visualized in the UrbanLogiq platform
Generate user-friendly reports to drive deeper analysis
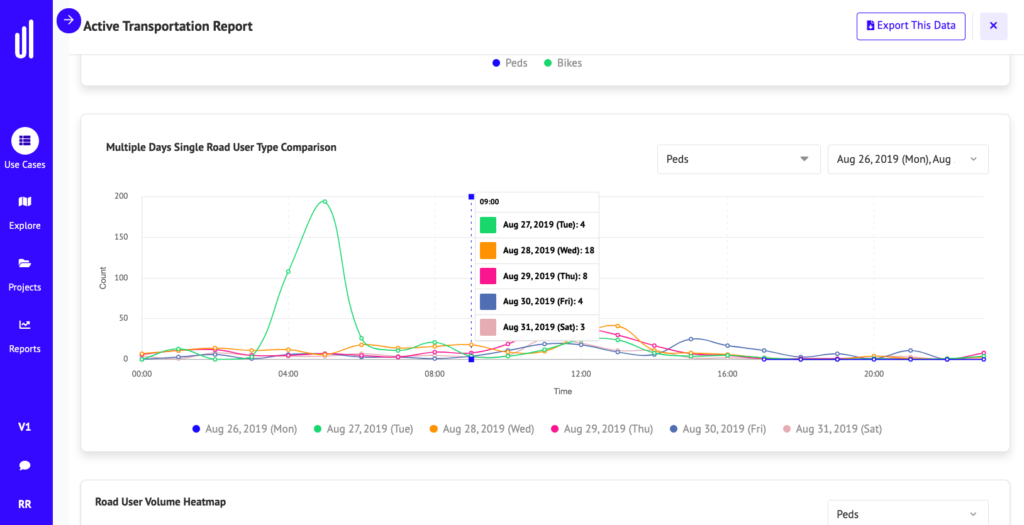
The UrbanLogiq Reports feature enables users to generate and share insights with just a few clicks. Reports showcase useful data summaries and user-friendly visualizations and can be exported to a variety of standard formats.

Comparing daily pedestrian and bike counts at a high usage location
Integrate active transportation data with other relevant data for a more comprehensive picture
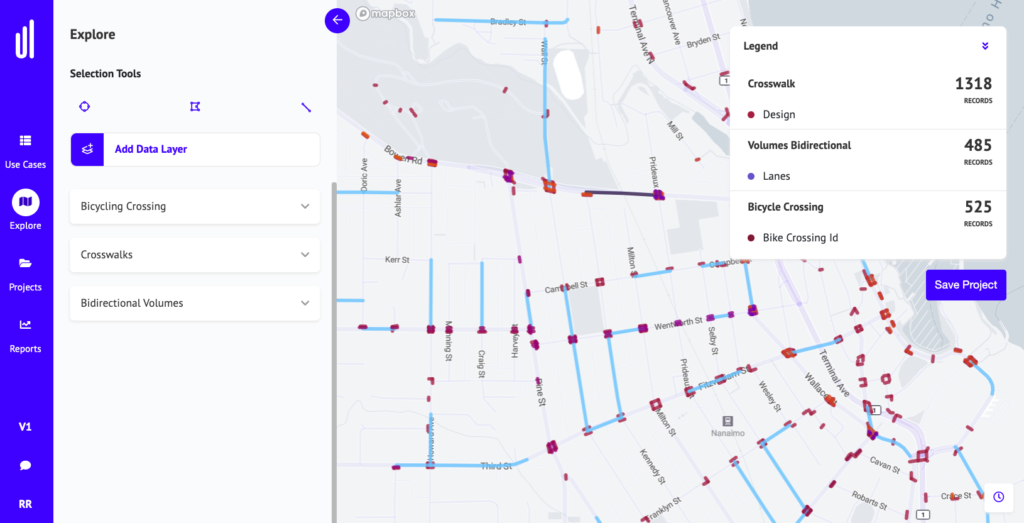
UrbanLogiq’s data engineering services make it easy to integrate active transportation data alongside other contextual information such as crash data or GIS infrastructure layers.

Crosswalks and bicycle crossings visualized in the UrbanLogiq platform
We can’t improve what we can’t measure; implementing efficient systems for data analysis makes it easier to evaluate the progress of active transportation-related KPIs and assist in the design of well-tailored strategies to increase active transport trips safely and effectively.
Want to learn more?
Get fast, timely insights from your data to better track mobility in your community. UrbanLogiq helps agencies move away from labor-intensive manual processes, centralize critical workflows, and get to insights faster. Contact us today to book a 30-minute demo.

