Data Engineering 101: A Guide for Government Officials
Written by: Rachel Rasmussen, Elora Dulac
Data is a powerful resource that has a profound impact on policy and decision-making within government. To that end, equipping our public officials with high-quality data and effective data analysis tools is central to positive community outcomes.
In a perfect world, this road from data collection to insights is direct, newly paved, and pot-hole free. In reality, it is a lot bumpier — particularly for public officials with limited resources. The reality is getting raw data into workable formats is a very manual and time-consuming process, especially for government officials.
Why data engineering?
Today, there is an emerging domain in data companies called “data engineering.” This is, in short, the process of building digital infrastructure and processes that systematize and automate data management, governance, and transformation. While the entire domain of data engineering is rich and complex, there are common practices being developed within data engineering that can significantly ease the burden of data analysis. These practices can be easily implemented in organizations today without the need for any coding or technical expertise.
In this guide, we delve into the challenges that public officials face when transforming data into useful insights and provide an introduction on how some data engineering fundamentals can help to overcome them.

The trouble with data collection
Government agencies rely on many different data collection methods, but the most prevalent among them is manual data collection. Manual data collection, as the name suggests, is any data that is collected using manual processes. This includes surveys, interviews, questionnaires, physical counting, and more.
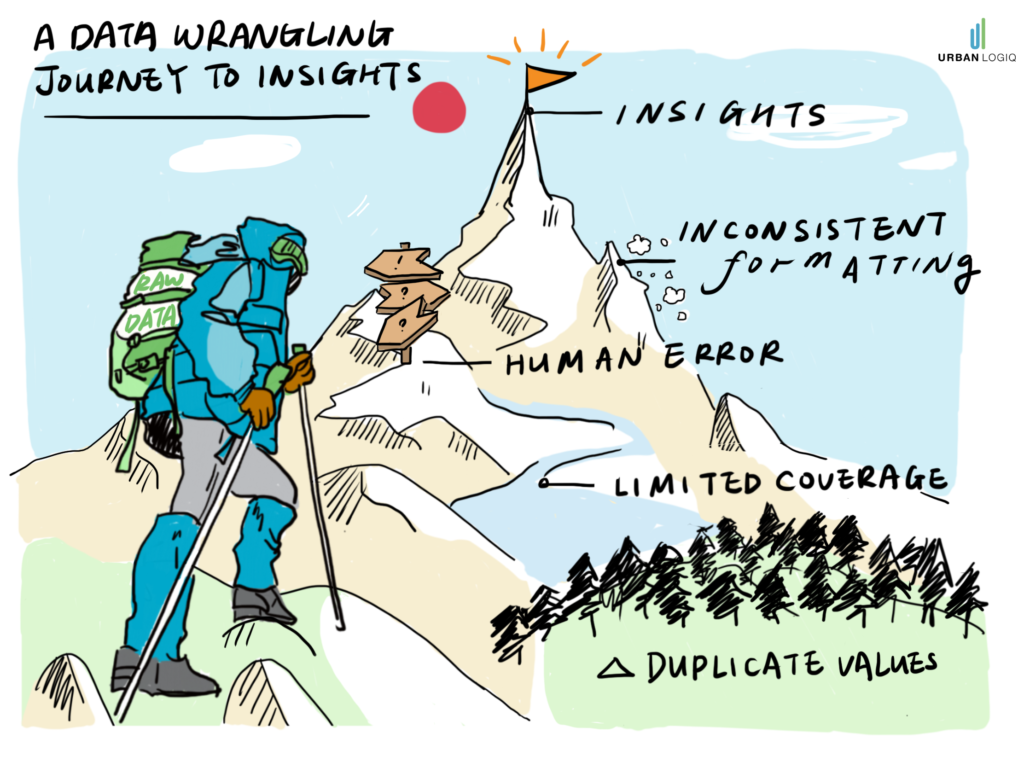
There are a number of drawbacks to manually collected data, including but not limited to:
- Limitations in sample size or study area
- Inconsistent reporting conventions across different consultants and vendors
- Human error
- Duplicate data
- Requires cleaning and standardization
In 2020, the onset of the COVID-19 pandemic revealed further underlying kinks in the manual data collection landscape, mainly:
- Lockdown orders and social distancing stalled manual data collection schedules
- The deliverables and data storage formats of manually collected data were discovered to be not very remote-work friendly. For example, PDF and Excel files, email, and paper copies
- Tracking data-oriented workflows among a distributed workforce with imperfect tools was identified as a challenge
Insights — not so straightforward after all!
While manual data collection remains an important way to capture information, the points above illustrate how hard it can be to maintain reliable and consistent access to and use of data. Ultimately, not only does deriving insights from manually collected data require a great deal of time and energy, the cost of deriving these insights is actually extremely high.
The complex nature of data
One of the biggest obstacles impeding public officials from making the most of their data assets is the complex nature of raw data itself. Newly acquired data is often inconsistent or varying in format from historical data, unable to integrate with existing tools, or stored in formats that don’t lend themselves to easy analysis, leading to suboptimal use of important information.
This is where some of the first principles of data engineering come in.
Data engineering 101
One of the fundamental components of data engineering is the process of organizing and manipulating data to enable data-driven analysis. It has become an essential process for most teams working with data, because it enables consumers of data to reliably and quickly access the information they need in a clear, standardized way.
The best part is, you don’t have to be a data engineer to begin. By understanding the basics, you as a public official, regardless of your technical expertise, turn them into insights that can be trusted and used on a regular basis.
Here we’ve laid it out step-by-step.
1. Structuring your data
Structuring your data in an efficient way is equally as important as the steps to follow. Let’s say, for example, that it’s Monday morning and you need to access traffic counts from a few years back. Your database, however, is full of individual files of various formats without a consistent naming convention (is it W First St. or 1st Street West?). In order to find data for the appropriate intersection, you will need to sort through many files and folders.

In order to improve the structure of your data, and therefore your efficiency in accessing information, below are two helpful tips:
- Maintain a central or master file to track specific data types, for example, manual traffic counts. The structure of this file could be as basic as:
Filename | type | year | location
- Create some sort of structure, and stick to it. If you have a structured database containing relevant folders organized by time and type, navigating to the right dataset will become much easier.
Structuring your data not only helps you find the correct data faster, but it enables you and your team to more easily understand what data you have (or don’t have) at a glance.
HINT: Set the standard! You have the power to dictate the nomenclature and conventions of your data collectors. Your GIS team likely already have standard naming conventions for most street names and if not, open naming standards like Open Street Maps can be adopted. Doing away with the W 1st Street or First St W is difficult but if you start now and remain diligent in managing collection standards will do wonders for data governance in the long run.
2. Schemas and Exploratory Data Analysis
A critical task after receiving new data and structuring (organizing) it, is to actually dive into the data and determine its schema by way of an ‘exploratory data analysis.’ Schemas are, in short, how your data looks, how it’s organized, and the attributes that it contains.
Using an excel spreadsheet as an example, possible schema attributes might include:
- The spelling of column titles
- Whether or not you use tabs within the spreadsheet vs simple continuous cells

Variance among data schemas are one of the biggest culprits of not having data that is interoperable. Consider, for example, how you might organize your data by date. Do you choose day/month/year formatting, or year/month/day? Different data providers and consultants use their own terminology and their own formatting. Missing or inconsistent values will create issues down the road in the data cleaning phase.
TIP: Consider asking all of your data collection providers to use a standard template!
Following the two steps above will help anyone using data for decision-making to do so more effectively.
One of UrbanLogiq’s core competencies is to perform data engineering processes at scale using machine learning, supervised classifier algorithms (a subset of machine learning) in order to turn large volumes of data into useful insights.
Below are additional steps to be aware of as a consumer of data insights.
3. Extract, Transform, Load Pipelines (ETL/ELT)
Extract, transform, load (ETL) pipelines are a process used to make large volumes of data look the same, and one that most people working with data will undertake. The intended outcome is to have normalized information that looks the same for ease of interpretation. The ETL process is usually divided into 3 steps.

Step 1: Extracting. During this step, information is extracted from individual files.
Step 2: Transforming (cleaning). This step is usually the trickiest and the most time-consuming, and it’s during this stage of data engineering that having consistent formatting will help significantly. Here, data cleaning refers to normalization (i.e updating a naming convention to be consistent) and is required to perform effective data analysis.
Step 3: Loading and formatting. During this final step, you will choose how to store the data and how to visualize it.
Once the above steps are completed, your data should now be consistent and easily readable.
4. Validation and normalization
After transforming data into one consistent format, it’s necessary to validate the data and check its quality. This is done through such checks as:
- Looking for duplicate values in the data (this generally indicates errors).
- Finding outliers by way of a quality check. Outliers are generally a result of error and can often be hard to detect
- Looking for any geolocation issues. This could involve inconsistencies with the name of a location vs where the coordinates are pointing.
Data validation and normalization is especially important when analyzing Big Data. Validating data requires asking questions like, “is this data representative of the population I’m looking to measure?” “Are there outliers and are they actual outliers?” “Are there gaps in the data that I wasn’t previously aware of?” Discovering blind spots and understanding what you don’t know is just as important as what you do know.
NOTE: The checks listed above are non-exhaustive, as validation is an ongoing process where checks will be added depending on the type of data you receive.
5. Geocoding
Geocoding involves getting data into a geospatial format, or in other words, onto a map. Putting data on a map enables the purveyor to visually identify gaps or correlations that may be more difficult to ascertain in a tabular format. Planning for geospatial data analysis is vitally important to build into your data schemas.

Multiple data layers that have been normalized, geocoded, and visualized geospatially within the UrbanLogiq Platform
How UrbanLogiq helps
As mentioned above, one of UrbanLogiq’s core competencies is to perform data engineering processes at scale using machine learning to turn large volumes of diverse useful insights. We take data that is unstructured, structured, or coming from technical systems and applications via API, and normalize that data so that it can be easily consumed by anyone, regardless of their technical expertise.
Our systems architecture governs, quality assures and protects data. It then wrangles that data to produce trusted and actionable insights
It looks a little something like this:

Data is relevant to every area of our lives, and being able to effectively analyze it is an invaluable muscle that many government agencies are working to build. A growing movement towards more effective data analysis in the public sector has seen many government agencies make incredible strides to implement the right strategies to better collect, manage, and analyze, and use data to serve their communities.
Taking a systems approach to data collection and data management will help make insights from data more trustworthy, more accurate, and easier to access and share.
Want to learn more?
UrbanLogiq helps agencies move away from labor-intensive manual processes, centralize critical workflows, and get insights from data faster and more effectively. Contact us today to book a 30-minute demo.