How Spatial Data Analysis Can Help Public Officials Improve Road Safety
In this blog, we’ll explore how public officials can use spatial data to improve road safety and progress toward Vision Zero. Society is no longer willing to accept traffic deaths as an inevitable part of transportation. As communities continue to urbanize and densify, there are more and more road users competing for space in our transportation system. Technology also plays a role; new mobility options such as electric cars, scooters, ride-sharing, and eventually autonomous vehicles contribute to the evolution of road safety. As our road networks become increasingly complex, bringing clarity and context to data analysis is imperative for cities to devise modern and effective road safety strategies.
What is spatial data?
The first thing we need to know is: what is spatial data? By definition, spatial data describes any data related to or containing information regarding a specific location. Think of it this way: if it can be shown or represented on a map with longitude and latitude coordinates, it’s considered spatial data. Road segments/links, intersections, political boundaries, and land parcels are all examples of spatial data.
What is spatial data analysis?
Spatial data analysis refers to the process of using spatial data to solve complex location-based problems. Spatial data analysis can be as simple as plotting crashes on a map, or as complex as using spatial data and machine learning to predict whether a road segment will see a fatal or severe incident, which we will explore further below. Most governments have a GIS department where certified GIS professionals use common tools such as QGIS or ESRI ArcGIS. In this blog, we explore some spatial data fundamentals as it relates to road safety. Even if you are a seasoned GIS pro, read on for innovations and fresh perspectives that you might not be aware of yet.

Example of spatial analysis: Crashes along Vision Zero Safety Corridors visualized in the UrbanLogiq platform
Barriers to analysis
Data quality and standardization are two of the biggest barriers to effective spatial analysis. This is because there is no universal standard for how to collect or store data. For example, information about a vehicle crash is oftentimes recorded on paper and may change hands between people across several departments. This is a prime example of how important information can get siloed away and contain inconsistencies or inaccuracies with vital details such as geolocation.
Another big hurdle that many government officials face is that the software tools available to them may not be not user-friendly or require in-depth training to perform spatial operations. As such, they must either wait for an expert in the GIS department to run an analysis for them or undertake a time-consuming manual analysis process. These factors make it difficult for officials who don’t have GIS training to generate insights on their own.
Spatial data and road safety
This process of analyzing spatial data is a powerful tool to understand the real-world factors that make roads and intersections more susceptible to fatal crashes. For example, if a residential building is built across the street from a grocery store without a crosswalk, the likelihood that people will cross the road regardless is high, posing a significant safety risk. In this simple example, the spatial data supports the installation of a crosswalk.
Leveraging data science and spatial data to understand roadside fatalities
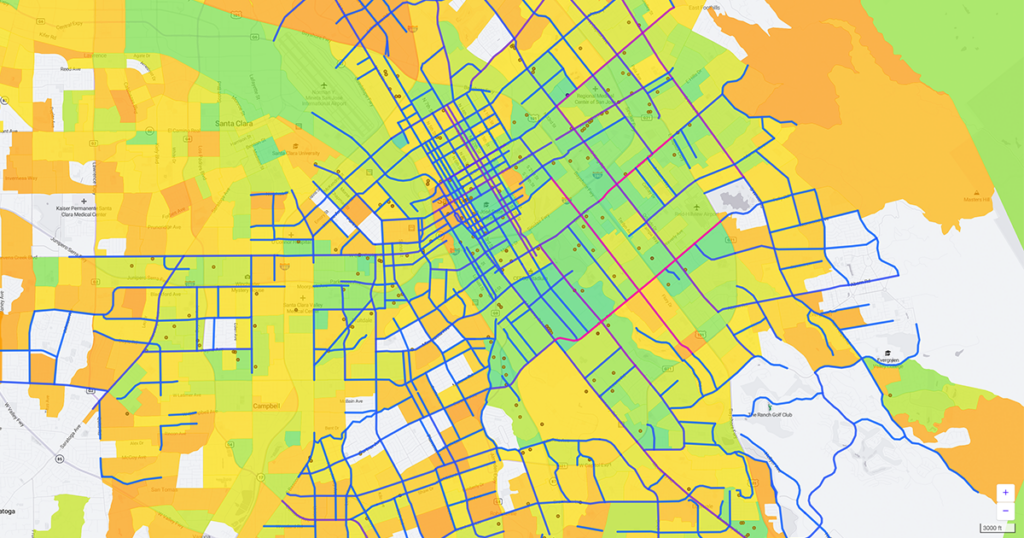
With the number of tragic road fatalities climbing, the City of San Jose, CA, sought to get to the bottom of what makes a road dangerous. The City partnered with UrbanLogiq in 2018 to properly leverage their spatial data to help answer that very question. Using 75,000+ historical crash records, 519 road segments, traffic count data for 701 intersections, building footprints and demographics, UrbanLogiq geocoded and processed this data, paving the way for the development of a machine learning algorithm that predicts the likelihood of an intersection experiencing a fatal crash.

Image source: San José Open Data Portal
The analysis revealed that out of the 11,000+ streets in the City of San Jose, 37 accounted for 30% of fatal crashes in 2017. Road features like stop signs explained 14% of road accidents. Non-road contextual features, like tall buildings, rainy weather, and high pedestrian traffic also play a role and explain 56% of road accidents. Performing this type of analysis is how officials can ensure that neighborhoods are safe, accessible, and usable by everyone.
Context is king
As our road networks become increasingly complex, bringing clarity and context to data analysis is imperative for cities to devise modern and effective road safety strategies. Visualizing data in context using spatial operations makes it easier to identify patterns and relationships and get actionable insights fast: insights that might otherwise be difficult and time-consuming to obtain by sifting through piles of excel spreadsheets or other forms of raw data with the naked eye. Without the visualization of spatial data the information can be essentially invisible, and when it comes to road and community safety that is the last thing you want.

UrbanLogiq helps public officials generate fast insights that help them target high-impact initiatives
How UrbanLogiq helps
UrbanLogiq is an easy-to-use data platform that democratizes spatial data for users of all backgrounds. Our software focuses on human-centric spatial data operations, meaning we require no specialized training. The UrbanLogiq data platform integrates and visualizes data of any type (spatial and non-spatial), source, or format, enabling officials to turn complex, fragmented data into compelling visual stories and actionable insights.
Contact us today to book a 30-minute demo at urbanlogiq.com.