Fire Analytics
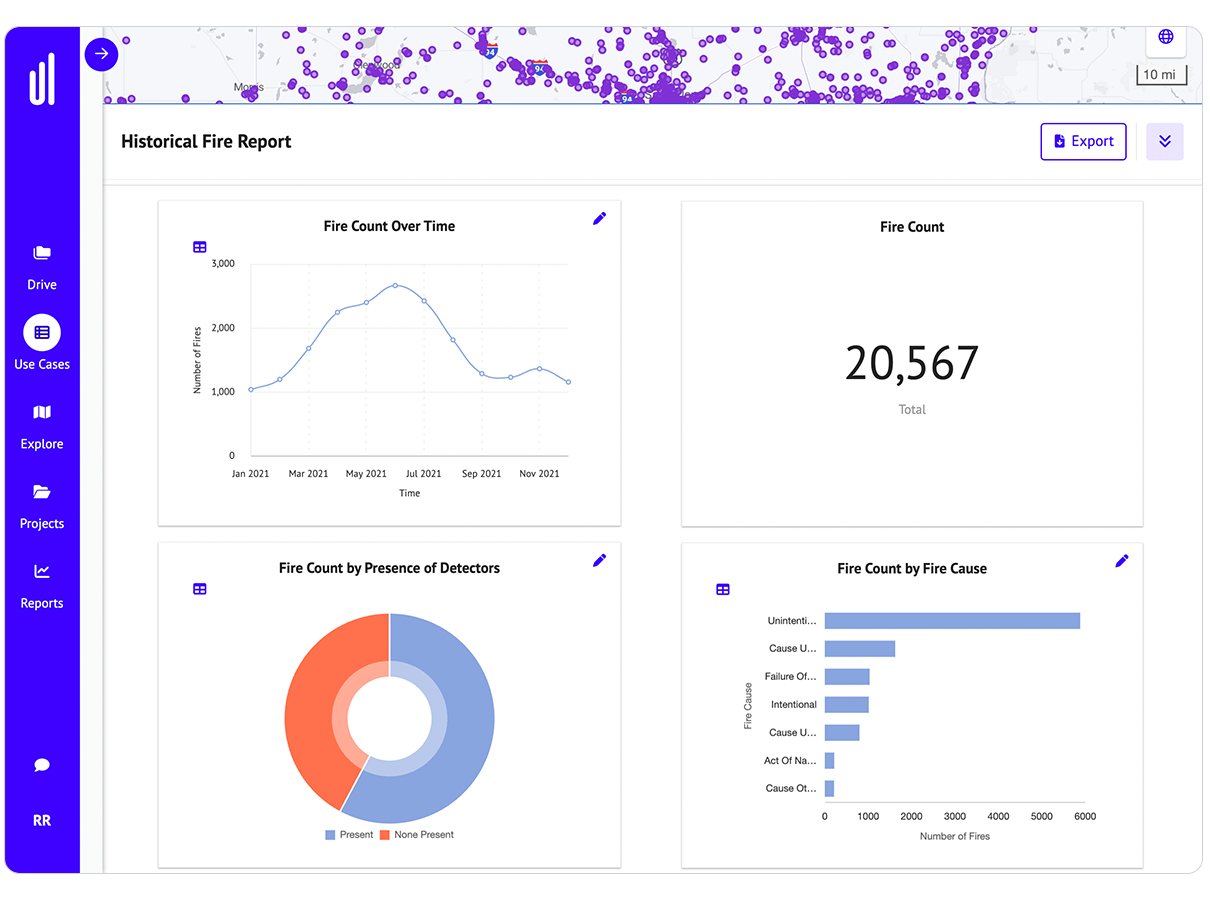
Analyze past fire interventions in your service area with a few clicks. Compare local and state-wide fire characteristics and visualize fire trends in your community.
Risk Assessment
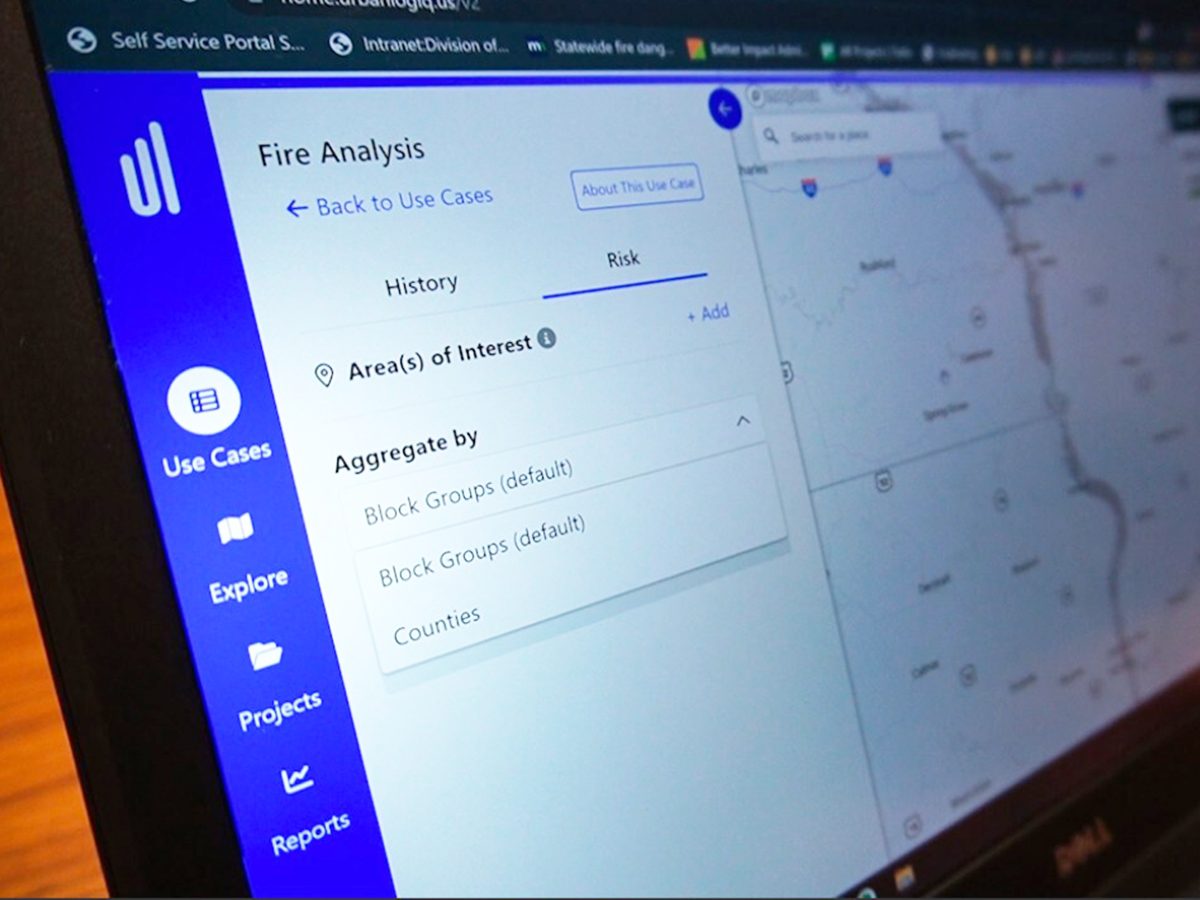
Visualize high-risk areas on a map and understand the demographic profile of high and low-risk neighborhoods.
Targeted Prevention
Understand the socio-economic factors contributing to fire vulnerability in your service area. Develop a prevention strategy to target high-risk populations more effectively.

Determine the underlying causes of fires with artificial intelligence (AI)
- Visualize and analyze all of your previous fire events and related data in one unified platform
- Understand the factors that contribute to fire risk using AI
- Determine what type of risks to focus your prevention efforts on in order to make the biggest impact
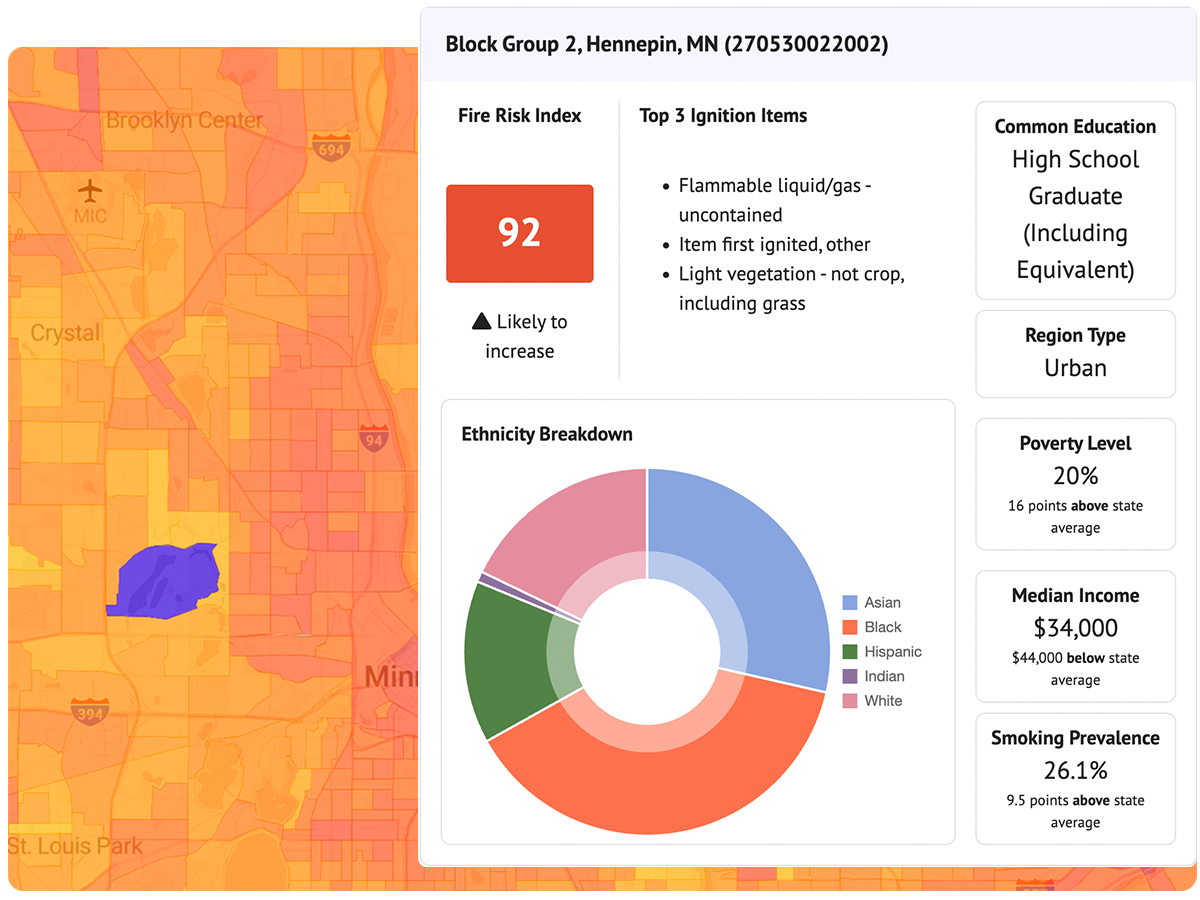
Identify the most vulnerable communities
- Rank neighborhoods by risk level and visualize the risk on a map for each locality
- Understand local community profiles such as ethnical diversity, median income, smoking prevalence, or education
- Design the right education and prevention strategies for each target audience
Anticipate interventions
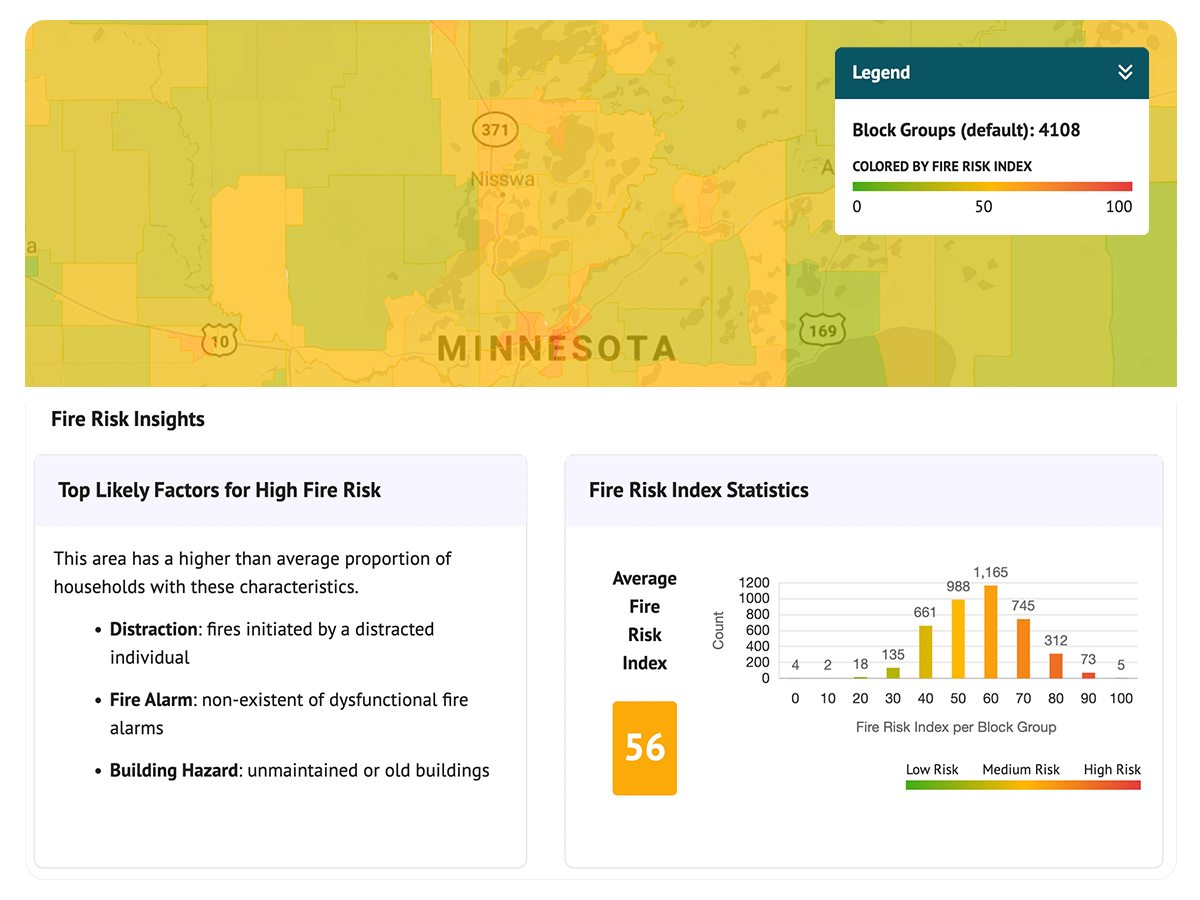
- Identify areas with a high risk of fire and determine whether the risk is increasing or decreasing
- Visualize global and seasonal fire event trends
- Measure the impact of your fire prevention efforts over time
- Compare the fire activity in your region with the state or regional average
Request a Demo


Trusted by governments across North America
Explore popular resources
Resources and best practices curated for data-driven fire professionals.
