Ask the Experts: Data Storytelling with Sean Bailey
In this episode of UrbanLogiq’s “Ask the Experts” series, we explore the important role of data storytelling with Sean Bailey, a research analyst at Downtown Van, Business Improvement Association for Vancouver’s downtown. We talk about why it is such a valuable communication tool, how it drives better-informed decision making and the key role it plays to advocate for a healthier and thriving downtown as well as empower businesses and stakeholders.
Meet the Expert: Sean Bailey is a community planner driven by his curiosity for how cities address critical challenges and provoke global change through local solutions. His background is diverse within the planning field but data and research has always been the foundation. The core of his work is to provide communities with the knowledge and resources they need to move forward together.
“Data isn’t scary. If you don’t use data, then you’re missing out on an opportunity to more effectively communicate,” says Sean Bailey, Research Analyst for Downtown Van, BIA.
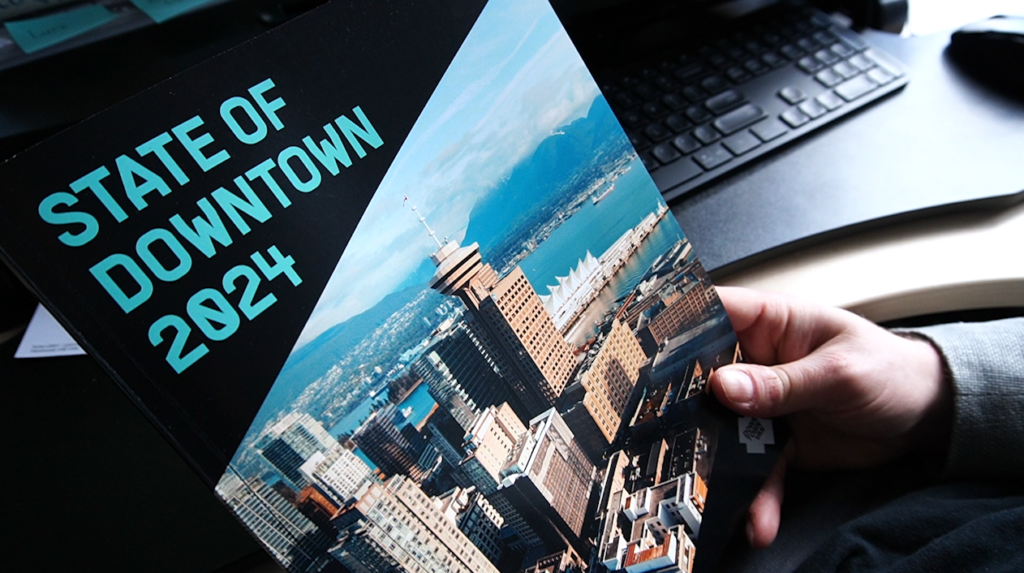
At Downtown Van, Sean provides insight to the downtown Vancouver stakeholders to support informed decision-making and is a key player in putting together the organization’s marquee publication “The State of Downtown” that provides a holistic look at what downtown Vancouver is experiencing.
Data tells and supports a story
In discussing the power of data storytelling, Sean Bailey emphasized the critical role that data played in understanding the shifting dynamics of downtown businesses during and after the pandemic.
“It starts with the anecdotal experience of business owners, of business managers and whatnot, and our data is just a powerful tool to support those,” says Bailey.
According to Bailey, careful monitoring of different data sets was essential to advocate effectively for local businesses as they navigated new challenges brought on by the shift to hybrid work environments. With fewer individuals visiting downtown areas, the impact on businesses was significant. Bailey highlights that keeping a close eye on the data allowed Downtown Van, a Business Improvement Association, to identify successful strategies and recognize those that were not working to ensure timely and effective support.
“Data supplements the stories of the businesses really well. It helps us to understand what is working and what isn’t working. We were able to support our businesses through advocacy in different areas,” says Bailey.
He adds, it also helps foster a sense of community among downtown businesses.
“Data has been important in helping downtown businesses know that they aren’t alone in some of the challenges that they’re facing. Each business is feeling, whether it be economic pressures or pandemic related pressures in the past five years or so, they’re all feeling them in various different ways.”
This comprehensive understanding through the use of data, places Downtown Van in a better position to empower member businesses and residents as well.
“Data storytelling can democratize the data itself and democratize the dialogue around what cities need and help people understand where their city is going or why their city has particular challenges,” says Bailey.
He says data is also crucial in dispelling misconceptions.
“If there’s no data, then you’re at the mercy of people’s misconceptions or people’s, you know, I suppose preference or things like that.”
Data can surprise you
One surprising trend he notes since the pandemic has been a cultural shift in how people utilize downtown. Bailey points out that while there are fewer people coming to the office Monday-to-Friday, 9-to-5 the data shows hybrid work has given way to more flexible schedules. While those who have returned to the office are coming in only three or four days a week, he says when looking closely at the data it showed that despite fewer frequent visits, more individuals are coming downtown—just less often.
“More people are coming downtown. More individuals, but they are coming downtown less often. So that was actually quite surprising, that there are more people visiting our district, but just come in less often,” says Bailey.
Bailey says this subtle yet significant distinction in the data reflects the evolving patterns of how people interact with urban spaces in the post-pandemic landscape and its important to showcase that in the data stories.
Data can be as bite-sized or as in-depth as you want it to be
The versatility that comes with data storytelling is another reason Bailey sees it as such a valuable, and compelling tool.
“It can be as bite-sized or as in-depth as you want it to be, which really helps you communicate to different parties and support decision making, maybe at a political level or at business level,” says Bailey.
Whether in succinct summaries or detailed reports. Data has the ability to convey and identify meaningful insights in various forms. Bailey says in his work it’s also enabled effective communication across different stakeholders but emphasizes tailoring the stories to your audience is key.
Membership for Downtown Van is broad, and includes various stakeholders such as property owners, small business owners, office managers and staff as well as politicians.
Key themes he says are how they ensure the insights and data stories they put out to their members resonate with everyone, whether it be on their public facing dashboard or their annual state of downtown report.
“We need to voice everything in a really understandable way. For instance, the walkability or say, access to transit, and how they impact other areas of downtown as well. We like to prop that up in our data storytelling,” says Bailey.
Visualizing data makes it easier to digest
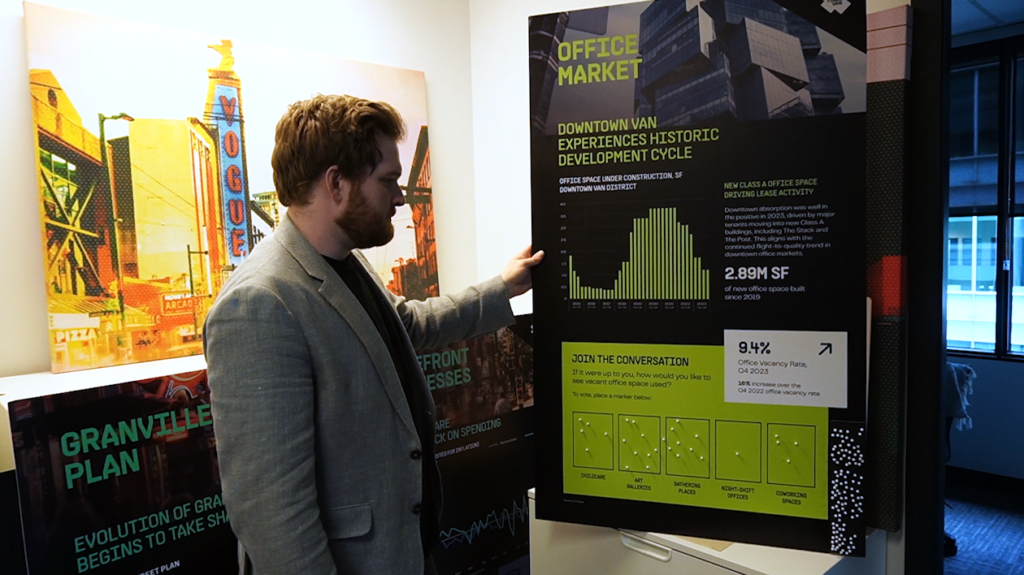
By presenting data clearly through visualizations, Bailey says it is much more digestible for everyone.
“We want everybody to be able to understand our data, so making sure that it’s presented in an accessible way, helps invite people to use it more, whether that’s, you know, the result of that is having your colleagues feel more confident with it or the, in our case, the downtown stakeholders being able to access it better.” says Bailey.
Data visualization offers a powerful solution for making complex information approachable and actionable. By transforming data into visual formats, such as images, graphs or infographics, Bailey says it transforms the information not only making data more accessible but also more tangible and relatable, moving it away from being an abstract collection of numbers, to something that can be easily understood and used.
Data is essential for effective decision-making and planning
Using data is essential for effective communication and decision-making, says Bailey.
Relying solely on anecdotal evidence may seem valid, but Bailey says it limits the opportunity to support claims in concrete ways.
“If you don’t have a complete picture of the data for us, it’s a complete picture of the health of downtown. Then you could easily make uninformed decisions or start going down a path that ultimately won’t bring you the desired results. In our case, a downtown that is welcoming and a downtown that is thriving for residents or businesses,” says Bailey.
Without a comprehensive understanding of relevant data, decision-makers risk pursuing strategies that don’t support their goals.
For example, exploring the impact of major events on downtown areas has become a recent focus Downtown Van says Bailey. He says analyzing past events helps gauge changes in spending, transit usage, and visitor numbers, which in turn help predict and support future events more effectively.
“Such as what downtown does when Taylor Swift comes and how can the downtown community leverage something like that? It can inform decision making around things like the world cup in 2026, the hotel or accommodation market downtown and what the impact will be on transit use when thousands of people come here to visit for the World cup,” says Bailey.
Anticipating global events like the World Cup in 2026, requires strategic data-driven planning and partnerships across various sectors, to ensure the city can fully capitalize on the influx of visitors. Bailey says this type of comprehensive data analysis not only informs decisions but strengthens the community’s ability to host and benefit from major events, enhancing Vancouver’s overall economic and social fabric.
Data storytelling is advocacy
Access to comprehensive data has been a game-changer for Downtown Van as an organization. Bailey says it’s allowed them to position themselves more effectively as the advocate for downtown businesses and residents.
“When you’re able to confidently speak to data, then you’re better positioning yourself to be at the table and to help and advocate for a healthier downtown,” says Bailey.
With a holistic view of the health and behavior of downtown Bailey says they can confidently share data-driven insights and advocate for their members and the community.
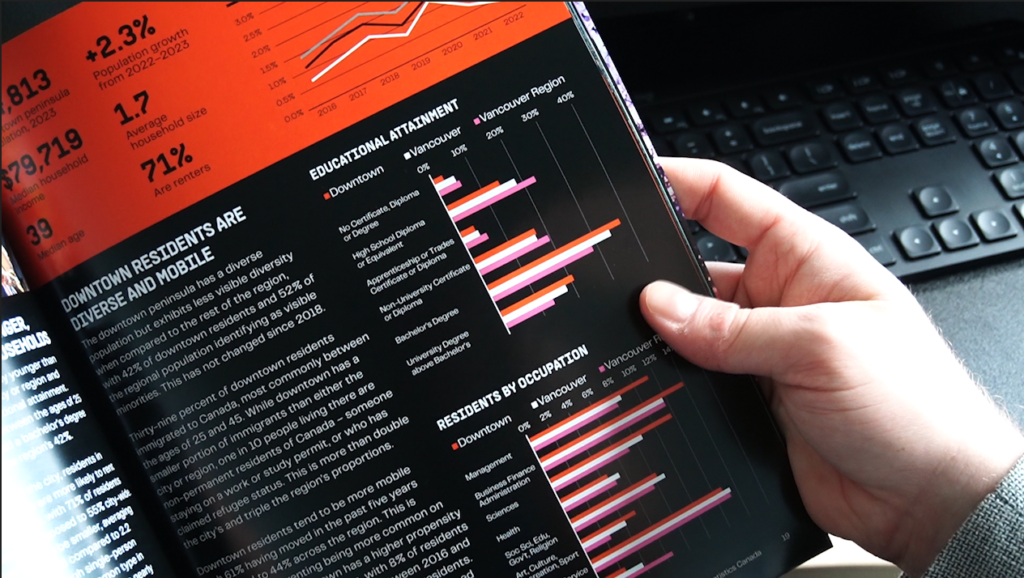
Speaking from the data storytelling perspective, Bailey says he often finds himself wishing that more people had access to the unique data library he feels so fortunate to have at his fingertips. Working closely with these insights, he sees firsthand how valuable they are for understanding the needs of neighborhoods, communities, and the city as a whole. He strongly believes in the value of data as a resource that helps push initiatives forward, advocating for a more vibrant and sustainable downtown for everyone.
“I always find myself wishing that more people were as lucky as I am to be able to access it and to draw from it,” says Bailey.
How UrbanLogiq helps
UrbanLogiq’s data analytics platform helps governments make the most out of their existing data by breaking down data silos and integrating diverse data sets, to inform better decision making. Our end to end data platform sets the standard around robust data management while addressing concerns around the responsible use of AI, security, compliance and integrity of data. This approach enhances operational efficiency and transparency to ensure safe and equitable communities.
Our story: https://youtu.be/hmp-eRd8OUg
About Ask the Experts
Urbanlogiq’s ‘Ask the Experts’ series launched in the summer of 2022. It taps into the knowledge of industry experts to explore a variety of subjects. These include artificial intelligence, data science, public safety, transportation planning, and more, offering insights on a variety of timely topics. ‘Ask the Experts’ sets out to provide valuable information and resources through in-person or virtual interviews and blogs.
If you would like to be a guest on the series, contact UrbanLogiq’s Head of Corporate Affairs, Luisa Alvarez.
